
GBPUSD Talking Points:
- GBPUSD is still above its January 2019 flash crash low, but on a close basis it is at April 2017 lows
- Sterling is lower across the FX market, but the speculative charge may render the markets stretched
- See what we expect from the Pound – and other key currencies, indices and commodities – over the third quarter
Technical Forecast for British Pound: Bullish
There was a brief respite from the Sterling’s constant bearish pressure these past months through the past few weeks, but a technical break on Friday would seemingly put us back into the current. With key pairs pushing new lows or on the verge of doing so, it seems an easy fate to fall into with tame volatility and an easy talking point on the fundamental side (‘Brexit’). However, there is technical and fundamental reason to keep tabs on sea change. Rather than representing a full reversal of course, an already-stretched Sterling is backed by significant pressure to merely rebalance back into a broad but established range. Speculative positioning from large sources in particular reflects directly on the pressure.
For taking the temperature of the Pound, there is no more recognizable metric than GBPUSD. The benchmark pair was in a holding pattern for much of last week, until Friday’s provocative breakdown. Had it not been for the ground swell in favor of the US Dollar following the US GDP release, Cable may very well have traced out the July wedge for another diminished swing or two. Yet, the break below 1.2445 represented a clean break for which most other Sterling crosses felt the residual wind.
Chart of GBPUSD with 20-Day Moving Average (6-Hour)
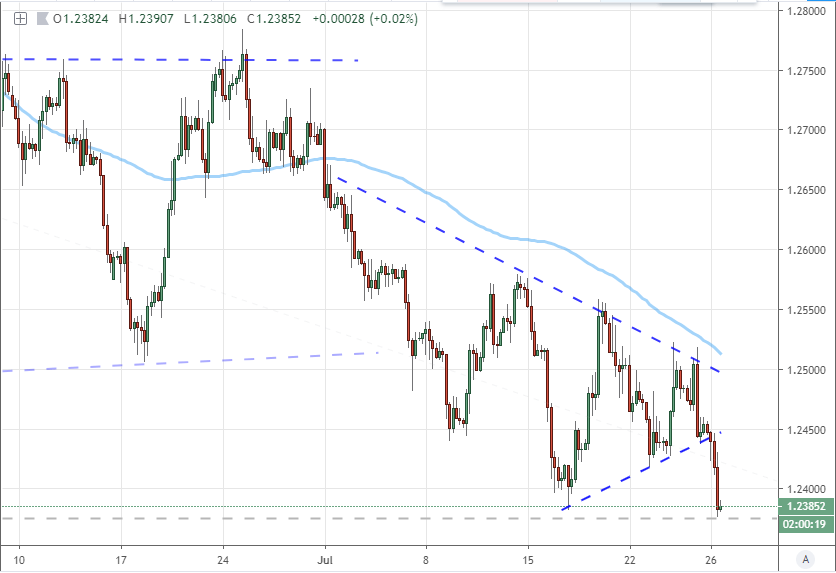
On a medium-duration time frame (daily), the break clearly pushes this liquid pair to a far more significant level. This level is generally in line with the swing low two weeks ago as well as the intraday low established with the early January flash crash that affected the Sterling as well as the Yen and Aussie Dollar. That massive tail holds relatively little technical clout, however, so we shouldn’t put too much stress on its presence.
Chart of GBPUSD with 50-day Moving Averages (Daily)

Notching the time frame even higher, we can better appreciate the technical relevance of trading south of 1.2400. We have not traded in this vicinity since back in April 2017. There is no mistaking the bearish pressure, but the weekly chart also eases the assessment of momentum. There is far less charge to this technical dip than what we had seen April through August in 2018 or even May of this year. Pace is important. A slow descent at already extreme levels – the late 2016 lows are three-decade lows – is difficult to sustain without fundamental pressure. Otherwise, the natural inclination would be for a return to the mean.
Chart of GBPUSD with 20-Week Moving Average (Weekly)

In assessing how stretched we are on a technical and fundamental basis with the Pound, it is worth consulting an equally-weighted Pound index chart (below) and Google Trends. On the former, we have a more remarkable dive than even what the Dollar-based pair shows. Dropping nine of the past 12 weeks and covering 7.5 percent in the process is an incredible move in FX terms. Momentum figures like the RSI offer some of the most remarkable stretch seen since the Brexit fallout in the final months of 2016. On the fundamental side, the pressure would naturally come from tumultuous EU-UK divorce. With new PM Boris Johnson threatening a no-deal Brexit, there is naturally remarkable pressure. Yet, further discount from an already heavily priced in risk alongside a rising probability of a general election to again defer the October 31st deadline and a natural slide in search interest in Brexit may seed the opportunity for moderation.
Chart of Equally-Weighted Pound Index with 50-day Mov Avg (Daily)
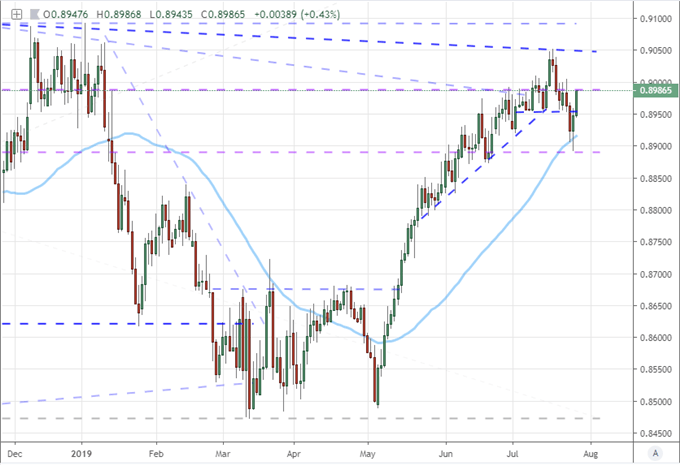
Looking on the crosses beyond the GBPUSD or the cumulative Sterling Index, there is technical intrigue that could readily render a bearish technical break for the Pound next week similar to the Cable; but it also reflect more run necessary before self-sustained momentum would naturally be assumed to have taken over. EURGBP is one such pair where its rally has trimmed the Sterling’s wing, but this would be the failure a head-and-shoulders reversal pattern breakdown rather than an extended bull run. That doesn’t come in until 0.9050 which is fairly robust technical overheard.
Chart of EURGBP with 50-Day Moving Average (Daily)
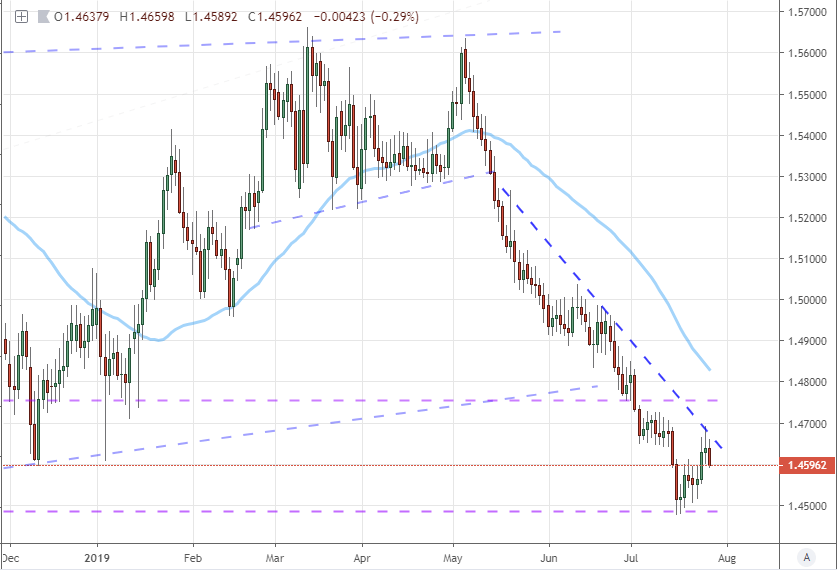
Furthermore, an unusual pair but one of the most over-extended of all is GBPCHF. The pair has tumbled from 1.3400 to 1.2250 in that same period of Sterling drop thanks in large part to the Franc’s steady appreciation. There is an external force pushing back against the Swiss currency’s further appreciation (though directly with EURCHF) in the form of the SNB. Meanwhile, the range low around 1.2250 is a multiple test trendline stretching back years. If there is any relief rally for the Pound, a break above 1.2400 could be significant.
Chart of GBPCHF with 50-Day Moving Average (Daily)

ingWhen laying out plans, it is important to always have an alternative scenario option scoped out. While GBPUSD and EURGBP could certainly stretch further, they are both already pushing the bounds of their broad ranges. There will be a reticence to give way to unrestrained momentum – which would mean stop and start progress that will naturally frustrate traders. For a pair that isn’t treading so close to the extreme floor of its historical range, I would look to something like GBPAUD or GBPCAD. Both the Aussie and Canadian Dollar’s have suffered pressure of their own which has worked to offer technical breathing room for any sterling retreat to cover. The past week has built up some near-term range to cover, but bigger dives can trip larger levels. Below, you can see the multi-year rising channel support in view around 1.7700 for GBPCAD.
Chart of GBPCAD (Weekly)

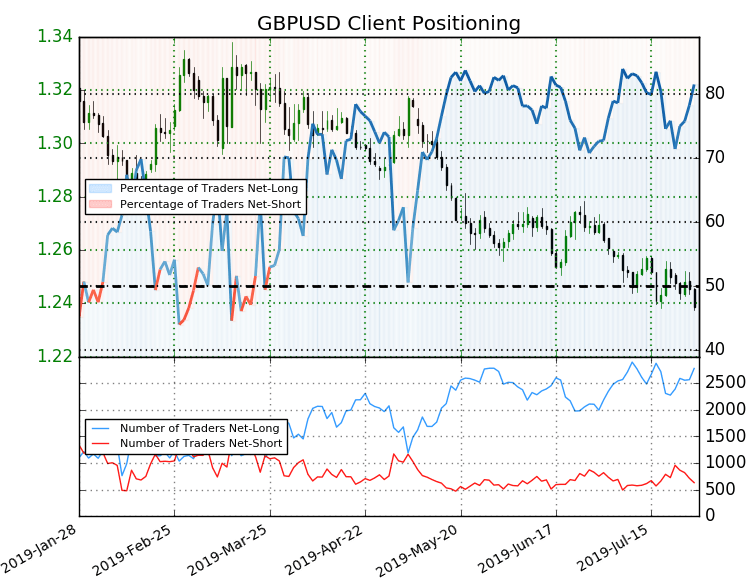
When evaluating the tension on the charged Sterling, the most provocative status update for a market already pushing the bounds in favor of the bears is through speculative positioning. In large futures positioning, we can see speculators have ramped up the short holdings on GBPUSD dramatically in just the past months as the new replacement of the Prime Minister was approaching – and so too were 2016 lows. Retail is flashing a somewhat different signal. There is a heavy net long interest with over 80 percent holding long exposure and that bullish crowd as large as it has been in a long time. At extremes, it can be can contrarian reading; but given their penchant for ranges, if reversion to the mean occurs in the drain on momentum, this will be a more straightforward signal.
See how retail traders are positioned on GBPUSD, EURGBP and other key Pound crosses on the DailyFX Sentiment page.
Chart of Net Speculative Positioning in Aggregate Pound Futures from CFTC Report (Weekly)
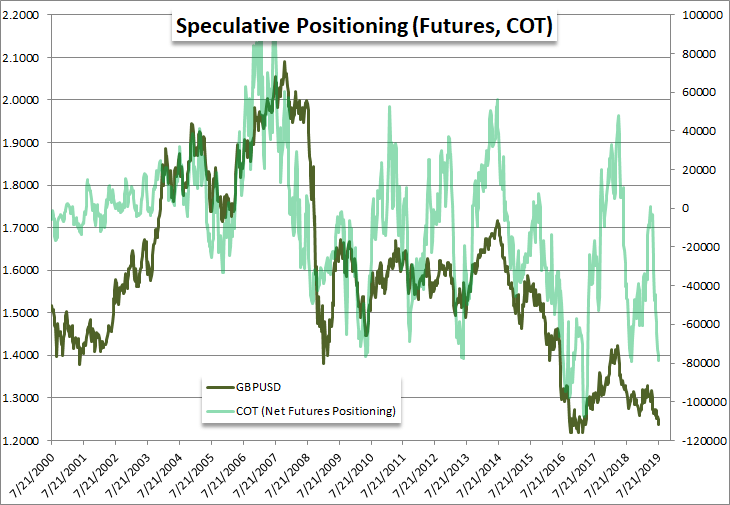
Chart of Retail Trader Positioning from IG Clients (Daily)