


Euro Technicals Talking Points:
- EURUSD is settled uncomfortably in its 150 pip range – holding the smallest pattern in 4.5 years
- From the Euro itself, we have seen a more productive bullish swing recently that may reverse ahead
- See how retail traders are positioned in EURUSD, EURJPY, EURGBP and EURCHF in real time
Technical Forecast for the Euro: Bearish
There are two ways to view the Euro lately. One perspective is that offered by EURUSD which has worked its way into an ever-dwindling range that is raising speculative of a medium-term, significant break while simultaneously encouraging short-term speculative traders to trade the pair aggressively. Yet, a look to the Euro independent of the Dollar, presents a very different picture. From most of its crosses, we find the shared currency has extended a multi-week rally. It isn’t a move that could readily qualify as a self-sustaining trend, but it nevertheless draws unmistakable contrast to the world’s most liquid currency pair. If you intend to trade the Euro moving forward, EURUSD should be considered given its weight; but rely on the other liquid Euro-crosses and even an equally weighted measure of the currency for your gauge of critical inflection/acceleration points as well as general intent.
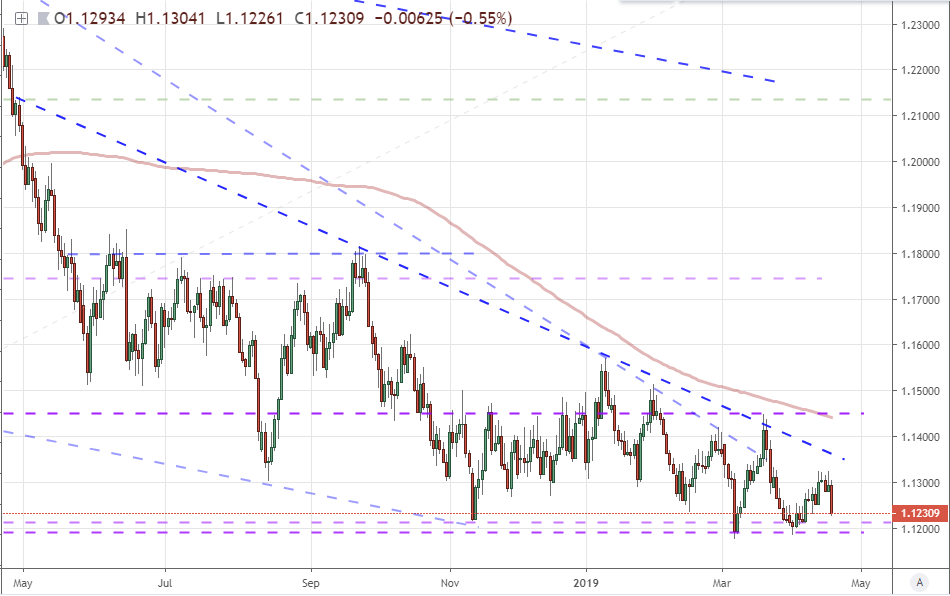
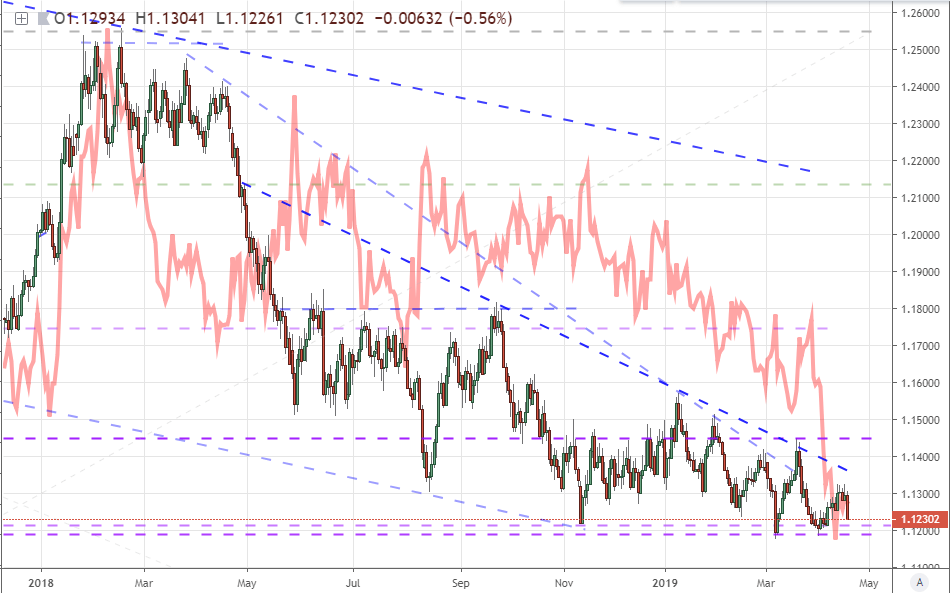
From the standard, daily chart of EURUSD below, we find the epitome of range-bound trading activity. The trend of lower swing highs dating back 10 months now establishes the most provocative resistance around 1.1355. That being said, the series of highs rejecting bulls at around 1.1325 is more immediate upside restraint while the 200-day moving average and mid-point to the 2016-2018 bull wave fall neatly around 1.1450. This is not a very broad zone of resistance which is consistent with an extended period of congestion. Support is more singular. While the November, March and April lows differ by as much as 40 points, they generally fall in line with the 61.8% Fib of the aforementioned ‘phase’ as well as the 61.8% Fib of the historical range of the exchange rate going back to the Euro’s trade inception 20 years ago. Watch 1.1200 very closely.
Chart of EURUSD and 200-day Moving Average (Daily)
As EURUSD continues to bounce between its converging boundaries, the expectations for a breakout (which is non-directional, but many confuse with a ‘break up’) naturally grow. Yet, recognition of the congestion does not equate to any extreme timeline resolution. Consider below a monthly chart of the same pair with an 8-month historical range that reflects only one period of quiet more extreme than what we have recently experienced – the Summer of 2014. While this signals the same inevitability of a significant return to trend, it is just as important to consider the time scale of the transition. This is a monthly chart and we have yet to see the sparks that would signal even the early vestiges of a break.
Chart of EURUSD and 8-Month Historical Range as Percentage of Spot (Monthly)
While the Euro itself is not as constricted as the EURUSD insinuates, it is still generally limited as to its trend development. Below, we have an equally weighted index made out of the seven most liquid Euro crosses. While the explicit technical levels do not translate readily to any individual pairs, the fact that the 1.3000 level seen in this chart held to multiple and spaced out tests back to August 2017 indicates a fairly consistent refrain from the currency. Through the end of March, bearish progress started to catch a little traction for a ‘break’; yet the markets were not ready to run with the move. These past three weeks offered a recovery that is now falling into a more reserved three-month span top. While it doesn’t offer any great insight for the likes of EURUSD, the general restraint could carry serious weight for the likes of EURGBP or EURCHF.
Chart of an Equally-Weighted Euro Index and 20-Day ATR (Daily)

A pair that offers a more recognizable picture relative to the equally-weighted index is EURGBP. The past few weeks have seen a measured advance that has found a general resistance waiting to slow its progress to a halt around 0.8675. We left this past week holding that boundary and an inverse head-and-shoulders pattern is still in place with this most recent jog higher. Under more active conditions, this would look like a loaded formation, but given the Euro’s stretch and the Sterling’s constant lack of traction, range is even more the path of least resistance.
Chart of EURGBP and 100-day Moving Average (Daily)

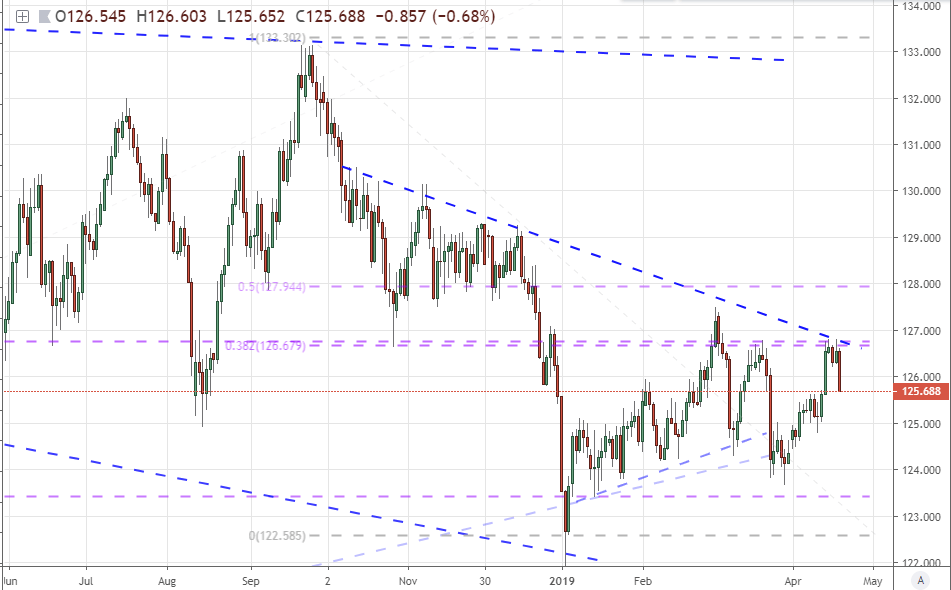
Already putting in a signal supportive of range, we have EURJPY which posted its biggest daily drop in a month on Friday to retreat from a fairly dense collection of resistance. The series of lower highs back to October now happens to coincide with the 38.2% Fib of the September to January bear wave (excluding the flash crash wick on January 3rd) and the 38.2% Fib of the upswing from the June 2016 low to last year’s February high all at 126.75. Range support is more of the ‘zone’ variety down around 124 to 123.50.
Chart of EURJPY (Daily)
In contrast to the hold of EURGBP and the tentative turn of EURJPY, EURCHF looks like it has achieved breakout velocity in favor of the more liquid currency in the pairing. Having broken through the 200-day moving average and the trendline pulled from descending swing highs back to August falling around 1.1350, it would seem that the threshold is crossed and the sky open to momentum. As impressive as this momentum has been – the strongest run over 15 trading days since August 2017 – it is still fighting the lackluster picture behind the Euro. The Franc has dropped across the board, but it is less likely to be the singular major that can develop a clear trend while the rest of the FX market struggles.
Chart of EURCHF and 200-day Moving Average (Daily)
If you are very convinced of the impending breakout and return to trend, it is worth consulting with implied (expected) volatility. The CME’s Euro Volatility Index below has shown a dramatic collapse spurred on by the short-term relief of certain key fundamental risks and heading into the long, holiday weekend. Given the historical congestion and the known liquidity drain of the holiday, it is reasonable to project a deflated chance of a charge for the Euro or EURUSD. However, much as the congestion is overdone, so too is the slide in volatility. I would treat this as a contrarian signal, but remember the time frames that we are approaching this picture from. While a break and more significant price swings are inevitable, it could still take weeks to realize.
Chart of EURUSD and CME’s Euro Volatility Index (Daily)
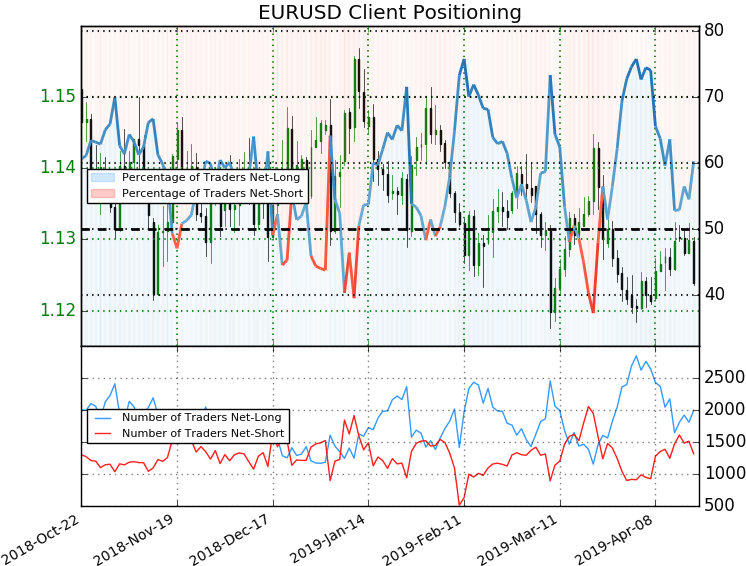
As we await the market’s next significant movement, it is worth considering how market participants are positioned behind the Euro. Larger speculative interests measured through futures by the Commitment of Traders report has the net short interest continuing to build through last week and sitting at levels comparable to the end of 2016 (when the pair was forming its bottom). In contrast, the more mobile retail traders are more than happy to continue trading surprisingly reliable range in EURUSD. Eventually, this group will call for another turn when the break finally does arrive, but they are well suited to the conditions that we continue to trace out.
Chart of Net Speculative Positioning in EURUSD Futures from CFTC Report (Weekly)

Chart of Retail Trader Positioning from IG Clients (Daily)
Other Weekly Technical Forecast:
Crude Oil Forecast: 50% Off the Lows – Can Bulls Continue Rally
British Pound Forecast: GBPUSD, EURGBP & GBPNZD
US Dollar Forecast: Big Test of Resistance Nearing
Gold Forecast: XAU at Support, Fresh 2019 Lows
Australian Dollar Forecast: AUD/USD and EUR/AUD May Be at Turning Points, Facing Trend Lines


