


Sterling FX-Pairs Technical Analysis
Q1 Trading Forecasts for a wide range of Currencies and Commodities, including GBPUSD and EURGBP with our fundamental and medium-term term technical outlook.
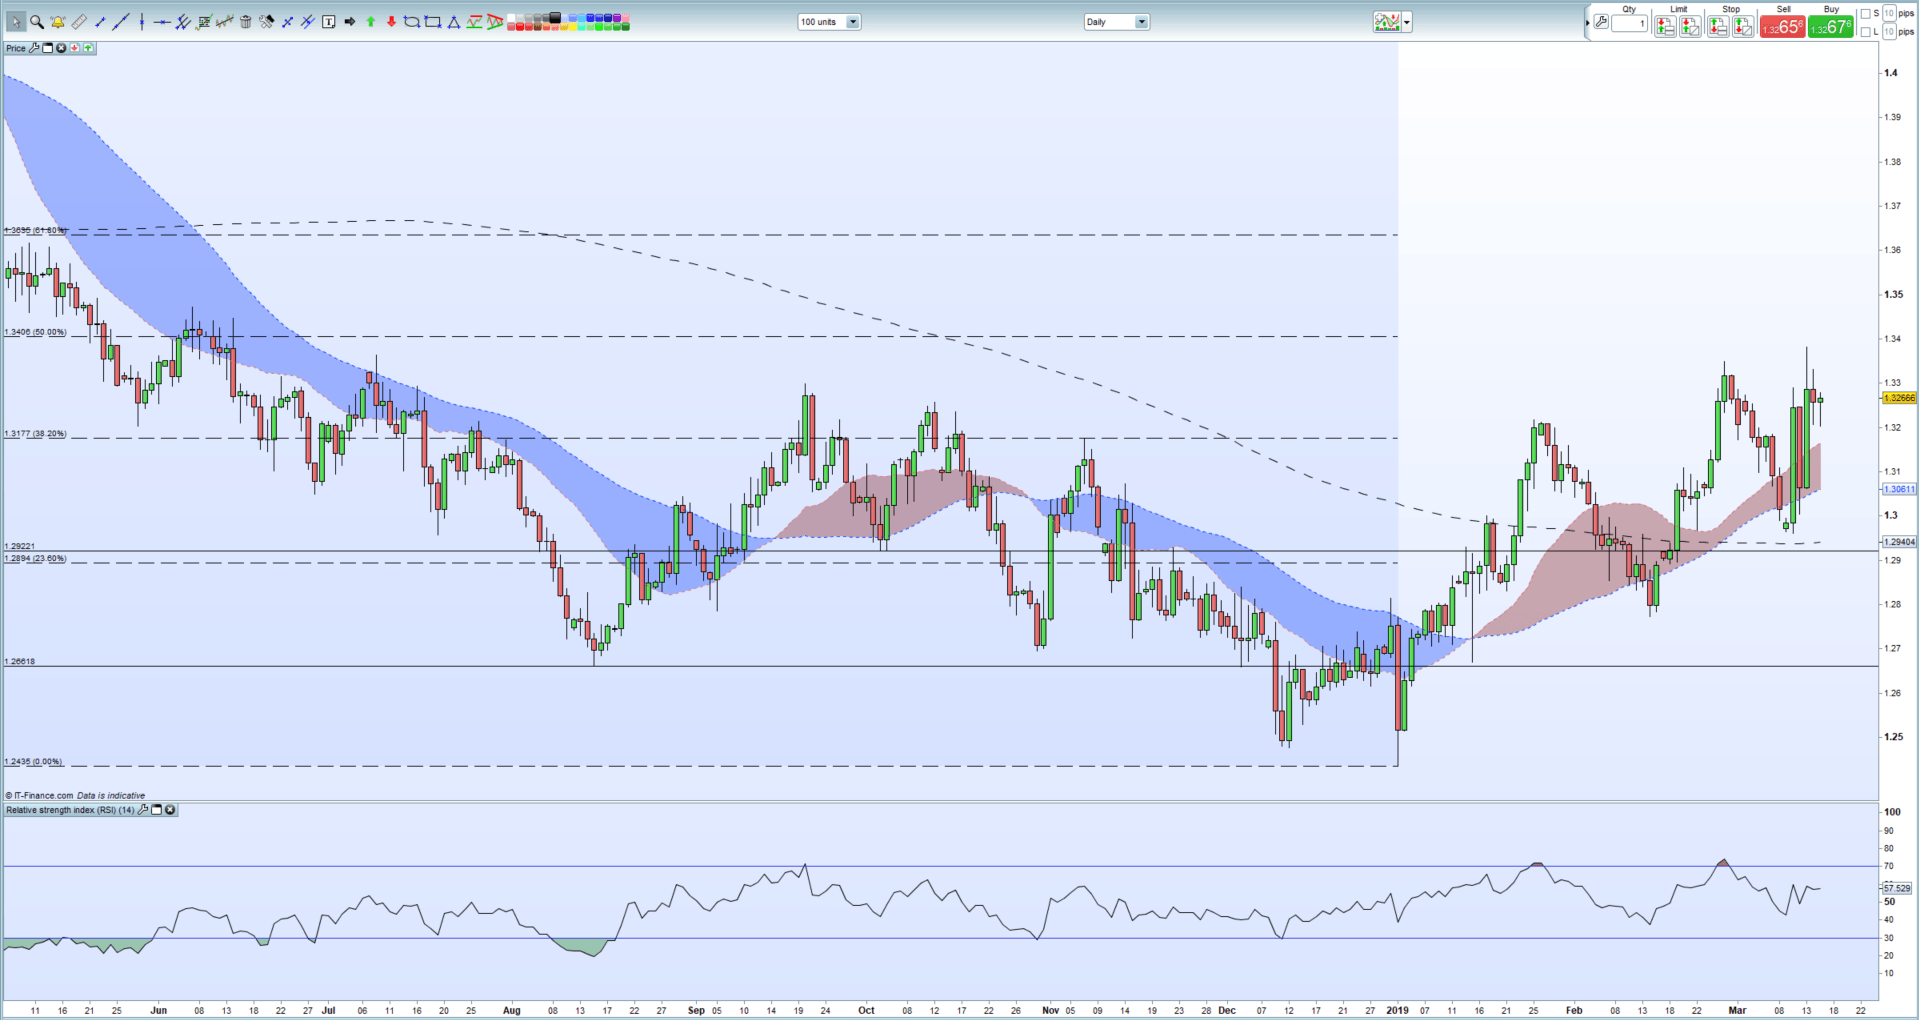
If you took Brexit out of the equation and looked at the GBPUSD chart you would likely think about entering a long-position as the current set-up is very positive. Since the start of the year, there has been a series of clear higher lows and higher highs, while the 23.6% Fibonacci retracement was broken mid-February and has not been seriously threatened since. In addition, the pair have traded above the 200-day moving average constantly since February 19 and above the 20- and 50-day this week. The RSI indicator shows a neutral backdrop, allowing for further price gains before the pair enter overbought territory. And just to add to the bulls’ case, GBPUSD broke the July 2018 swing-low and if the pair close above here, the 50% Fibonacci retracement at 1.3406 comes quickly into play.
How to Combine Fundamental and Technical Analysis.
GBPUSD Daily Price Chart (May 2018 – March 15, 2019)
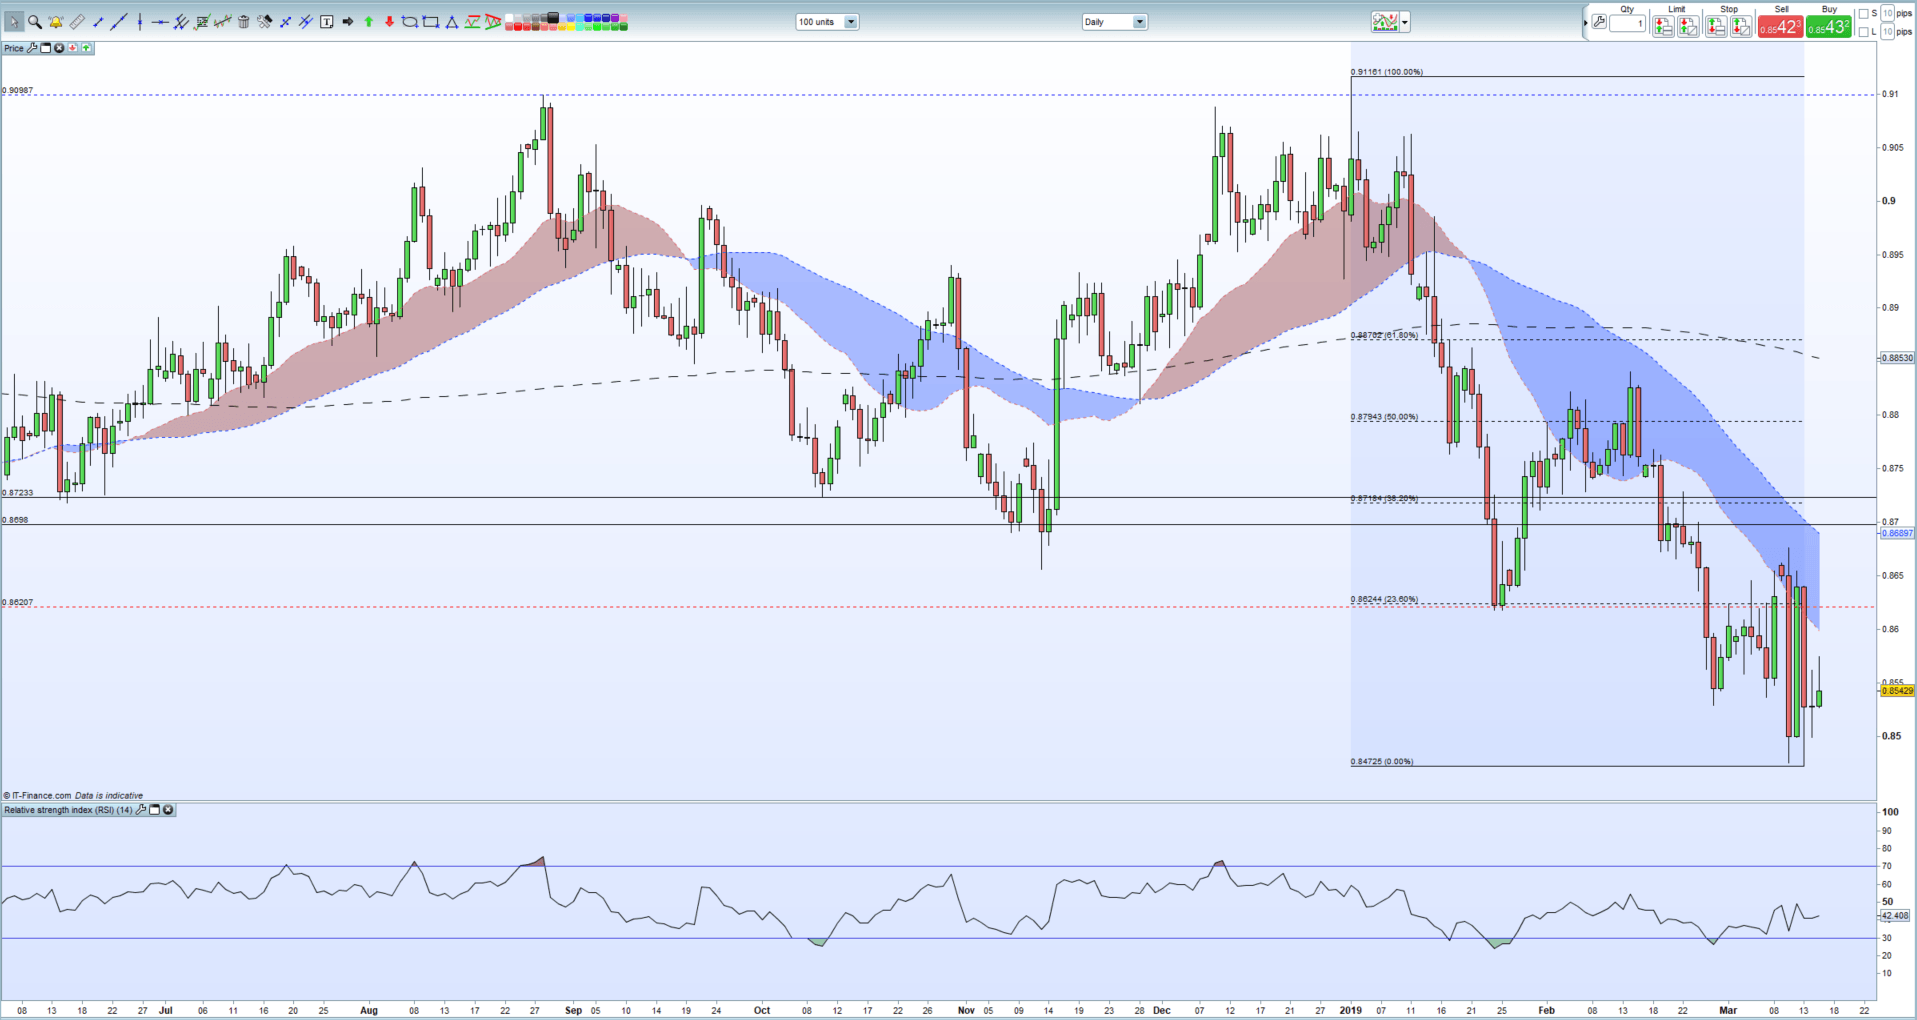
A highly volatile week with EURGBP ending the session in the bottom quarter of the weekly range. After touching the highest level since mid-2017 at the start of the year (0.9116), EURGBP touched the lowest level since May-2017 this week around 0.84725, a drop of over 7% this year. The daily chart shows the pair well below all three-moving averages, a negative set-up, while 23.6% Fibonacci retracement at 0.8624 will provide resistance in the short-term, unless Brexit negotiations take a turn for the worse. With German, and Euro-Zone economic growth slowing sharply, and with new ECB liquidity measures (TLTROs) to kick-in around Q2/Q3, the path of least resistance for EURGBP remains lower, with this week’s low at 0.84725 guarding two old 2017 swing-lows around 0.8382 and 0.8313.
Looking for a fundamental perspective on the GBP? Check out the Weekly GBP Fundamental Forecast.
EURGBP Daily Price Chart ( - March 15, 2019)
Interest Rates and the Foreign Exchange Market
DailyFX has a vast amount of resources to help traders make more informed decisions. These include a fully updated Economic Calendar, and a raft of constantly updated Educational and Trading Guides
--- Written by Nick Cawley, Analyst
To contact Nick, email him at nicholas.cawley@ig.com
Follow Nick on Twitter @nickcawley1
Other Weekly Technical Forecast:
AUD Forecast – AUD/USD, GBP/AUD and AUD/JPY Technical Outlook Bearish
Crude Oil Forecast– Prices Touches New 2019 High As OPEC Supply Doubts Remain


