


Crude Oil Price Forecast Talking Points:
- The ONE Thing: Crude oil has rocketed higher against the prior downtrend to the 38.2% retracement on a dual effort of a weaker USD, and supply constraints centered on Saudi cuts and Venezuelan sanctions. Now, the real positing test begins.
- Crude oil jumped by 18% in January toward $55/bbl. The sustaining backdrop of further gains will look to an increasingly weak US Dollar, and progress over the US-China trade war for support.
- ICE Brent net-long positioning reached a 10-week high last week and could continue as US Dollar weakness continues after an overly patient Powell on Wednesday took Fed Hikes off the horizon.
You are in luck, DailyFX’s Q1 2019 Crude Oil Forecast was just released
Technical Forecast for US OIL: Neutral
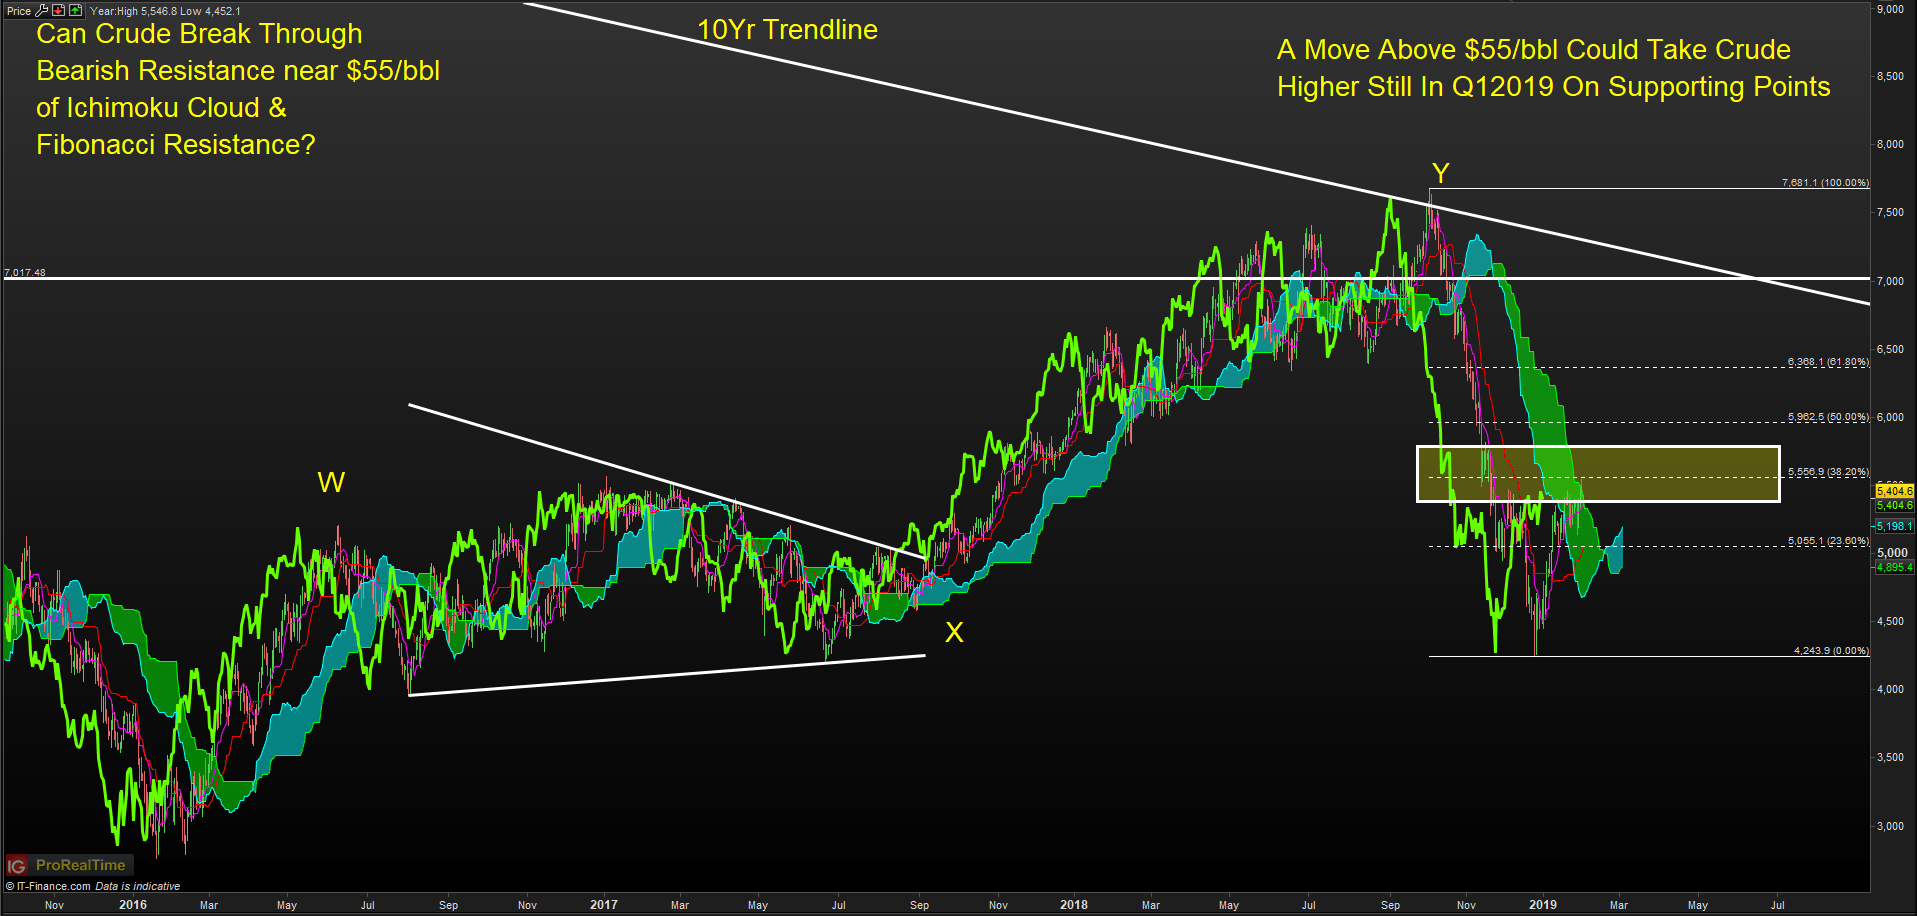
Chart Source: Pro Real Time with IG UK Price Feed. Created by Tyler Yell, CMT
The price of crude oil, and it’s near 20% advance to start the hear after a horrid Q4 is about to meet a critical test. That test is composed of the Ichimoku cloud with the lagging line (listen to a podcast on the value of this indicator) and the 38.2% Fibonacci retracement of the Q4 decline.
From a positioning standpoint, the bull’s have had the run of the show since the last week of 2018, and the price action has proven that true. Now, with a move higher in price on falling supply and a weaker USD, and a doubtful backdrop of aggressive growth due to Chinese PMI and recessions showing up in Europe bears may see an opportunity.
However, if bears remain silent, and fail to challenge the rise in crude, we could be seeing the start of an aggressive rally in a majority of risk assets in 2019. Crude has shown a strong correlation to high yield credit and emerging markets, typically the riskiest ways to trade credit, and equities respectively and all of which find support when the US Dollar weakens.
Looking for a fundamental perspective on crude oil? Check out the Weekly Crude Oil Fundamental Forecast.
Backwardation Beckons Bulls
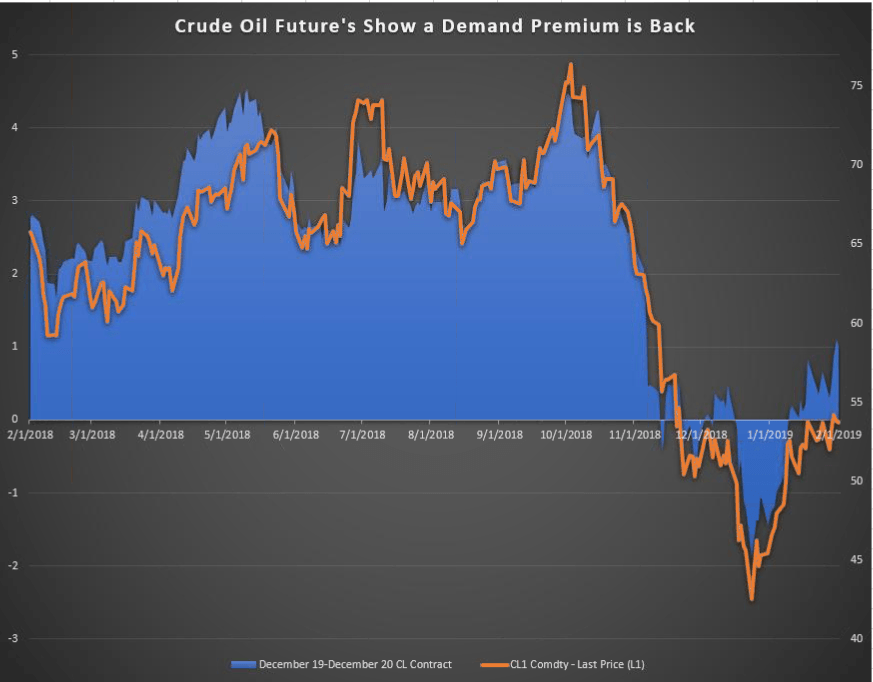
Data source: Bloomberg
The change in crude futures beyond the front-month is showing that fading the current move could be costly. The December 2019 crude oil future contract has traded at the largest premium to the December 2020 contract since early November.
A premium on a front-month contract in the future’s market of a homogenous product like oil shows stronger demand or a supply shortage such that the benefits of holding outweigh the costs storage, insurance, etc.
Looking to the chart, crude oil may well continue higher as it recovers from the 44% drop from October to late December. The current corrective or trend-consolidating move may well lead into another advance as the supply disruptions persist thanks to the upheaval of Venezuelan leadership.
Fly in the Bull’s Ointment?

Data source: Bloomberg, NY Fed Reserve
The technical picture is hitting resistance as alluded to above while the futures market continues to show signs of imminent buying pressure. However, there remains a fly in the ointment for crude’s future, and its head is poking up in Europe & Asia. A potential US Recession.
The chart above shows the yield curve spread of the 3-month Treasury Yield and the 10-Year or cash returns minus inflation and growth premiums in orange, which has narrowed sharply in recent years. The blue line is the New York Federal Reserve’s Probability of a Recession Index that is set to inch closer to alarm levels. Per Bloomberg’s Mark Cudmore, the indicator that currently sits near 21.4% chance of a recession has not surpassed 28% probability without a US recession ensuing.
Is a recession on the horizon? If so, crude demand and the crude price could find the Fibonacci resistance zone of $55-$64, which is the 38.2%-61.8% retracement level zone too much to handle.
We’ll see.
---Written by Tyler Yell, CMT
Tyler Yell is a Chartered Market Technician. Tyler provides Technical analysis that is powered by fundamental factors on key markets as well as trading educational resources. Read more of Tyler’s Technical reports via his bio page.
Communicate with Tyler and have your shout below by posting in the comments area. Feel free to include your market views as well.
Checkout DailyFX’s New Podcast: Trading Global Market’s Decoded on iTunes
Talk markets on twitter @ForexYell
Other Weekly Technical Forecast:
AUD Forecast – AUD/USD and AUD/JPY May Extend Climbs as AUD/CAD Holds its Ground
NZD Forecast – NZDUSD Rally May Stall at Resistance, NZDCAD to Test Support
US Dollar Forecast – Dollar Avoids Critical Breakdown, But for How Long?


