


Technical Forecast for the New Zealand Dollar:Mixed
- The Kiwi enjoyed a rally spurred by a firmly dovish Fed and now looks to tests resistance before a continuation higher
- Still, the pair resides between key technical levels resulting in an uncertain technical picture
- NZDCAD faces support after a hearty move lower on Friday
The New Zealand Dollar traded higher last week on the back of a dovish Fed and the pair now looks to test resistance at 0.6969. The level was an area of resistance in early December and has not been broken since mid-June 2018. If the move higher is to continue, this level will need to be broken. A close above 0.6969 should provide sufficient evidence of such a break.
NZD/USD Price Chart 4-Hour, June 2018 to January 2019 (Chart 1)
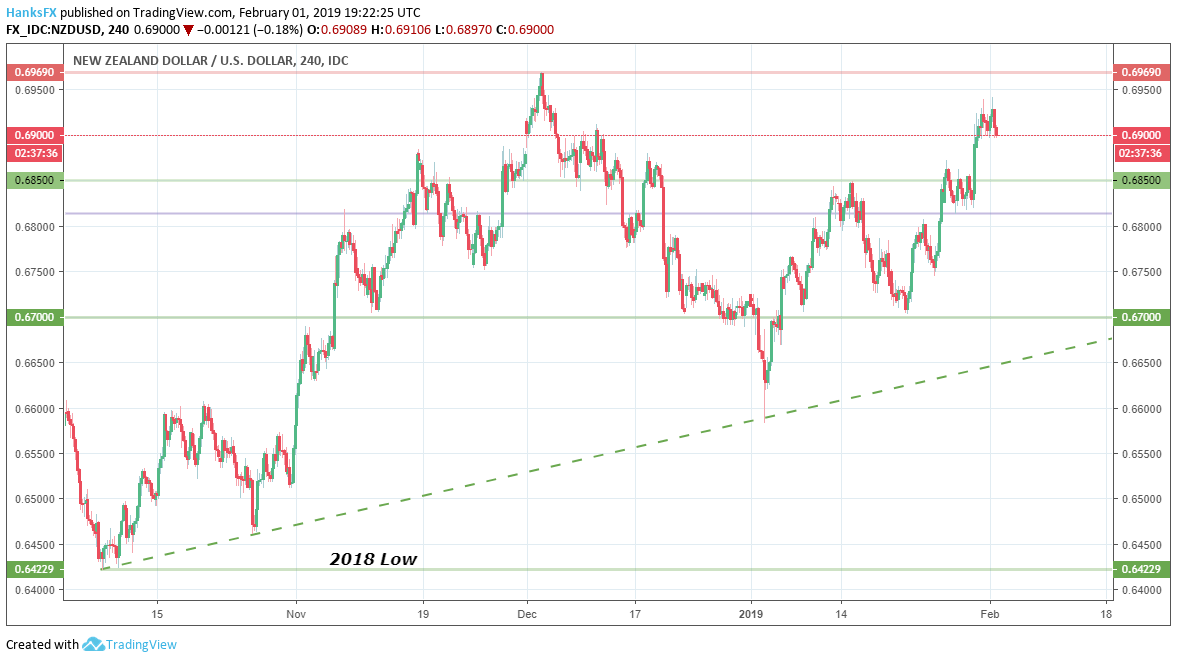
To the lower side, immediate support resides around the 0.6850 level. While the level does not demand significant respect, it is a point to be wary of given the moderate level of congestion it has created in the past. Below 0.6850 rests the 23.60% Fibonacci level originating from July 2014 around 0.6813. With NZDUSD trading in the middle of support and resistance, the technical forecast is mixed.
See our first quarter forecasts for NZD, USD, EUR and other currencies with the DailyFX Trading Guides.
NZDCAD Technical Outlook
Another Kiwi-cross with an interesting technical perspective is NZDCAD. If you follow me on Twitter @PeterHanksFX you will know I have covered the pair in-depth and recently exited a position. That said, the technical landscape remains intriguing and ripe for trading.
NZD/CAD Price Chart: 4-Hour Timeframe (December 2018 - February 2019 (Chart 2)

After a series of fundamental developments, the Canadian Dollar etched out notable gains versus the Kiwi on Friday. The move lower resulted in the pair breaking through the trend-line it had worked diligently to cross earlier in the week and now rests comfortably underneath. In the week ahead, the lower-bound of the recent range will continue to provide resistance and is the most immediate price level to the topside. However, after the breakthrough earlier in the week, the level may command less respect going forward.
To the lower side, the psychological level of 0.9000 should provide some moderate support. Slightly lower is a trend-line from 2009 in the 0.8990 area. Slightly below 0.8990 is the recent resistance trend-line from late December. It should now serve as support, but a concerted move lower would be required to reach that level.
--Written by Peter Hanks, Junior Analyst for DailyFX.com
Contact and follow Peter on Twitter @PeterHanksFX
DailyFX forecasts on a variety of currencies such as the Pound or the Euro are available from the DailyFX Trading Guides page. If you’re looking to improve your trading approach, check out Traits of Successful Traders. And if you’re looking for an introductory primer to the Forex market, check out our New to FX Guide.
Other Weekly Technical Forecast:
AUD Forecast – AUD/USD and AUD/JPY May Extend Climbs as AUD/CAD Holds its Ground


