


Equity Analysis and News
- S&P 500 | Descending Trendline to Spark Inflection Point
- FTSE MIB | Bearish RSI Divergence Raises Scope of Pullback
Looking for a fundamental perspective on Equity? Check out the Weekly Equities Fundamental Forecast.
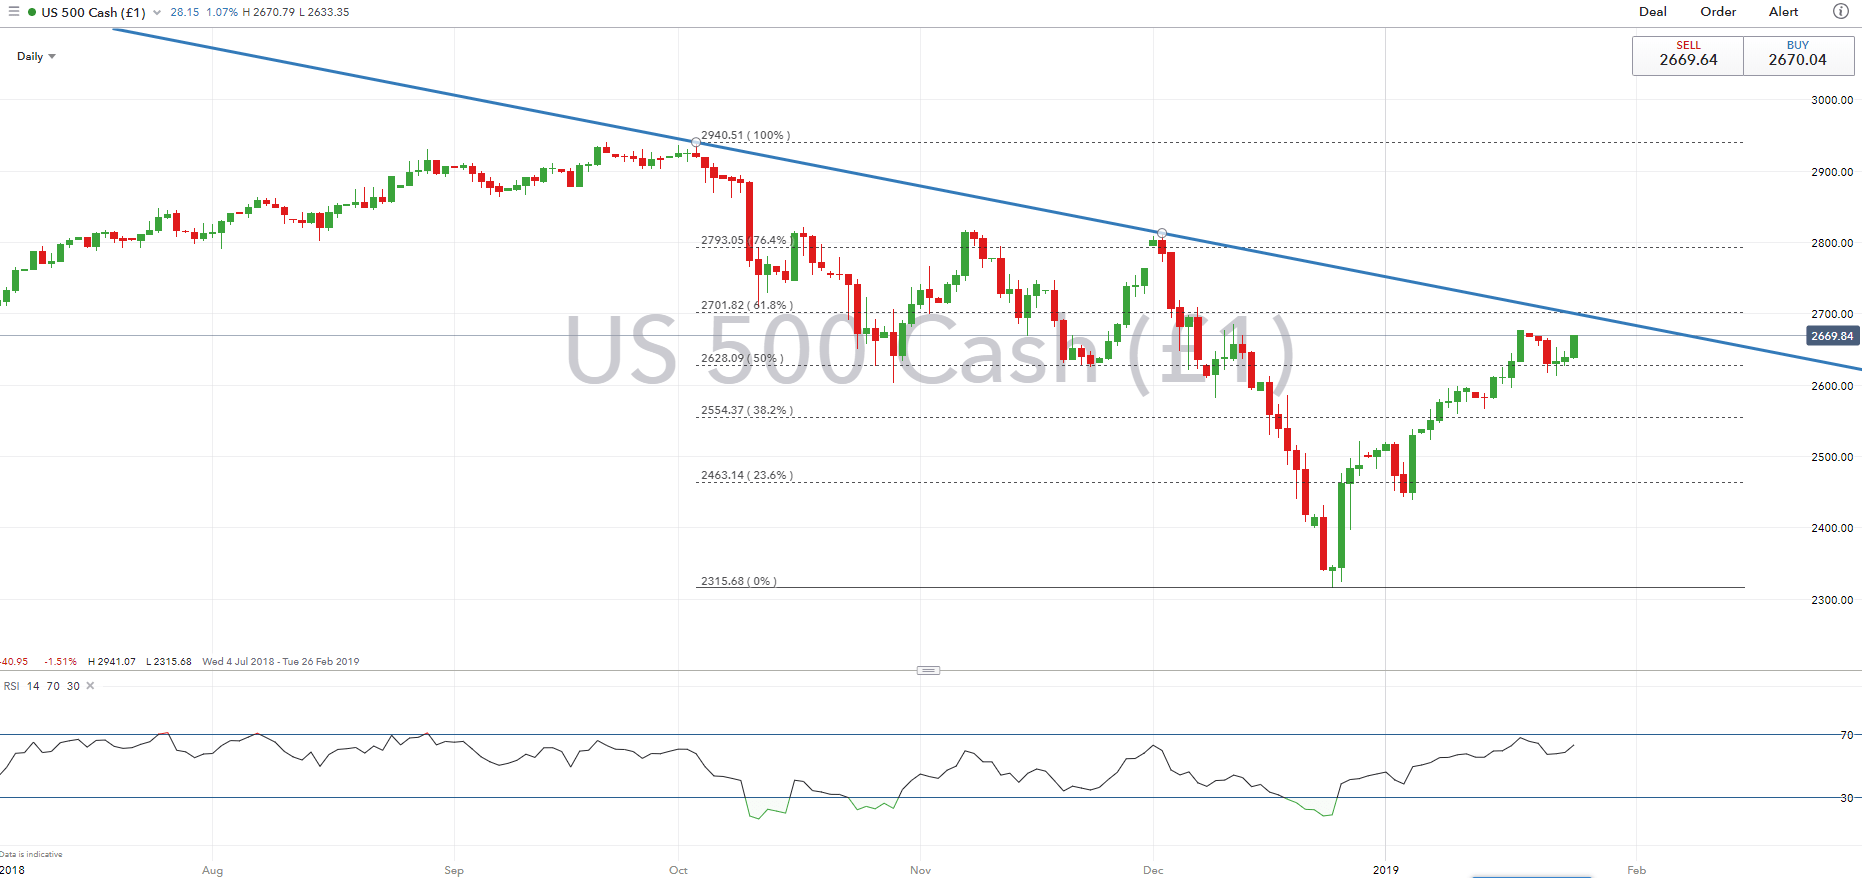
S&P 500 | Descending Trendline to Curb Further Upside
While the S&P 500 continues to edge higher, momentum to the upside has noticeably slowed as the index move towards the key 2700. Consequently, the run of gains in the index looks to be somewhat stretched with the trendline resistance from the record high at 2700 possibly set to curb further upside.
S&P 500 Price Chart: Daily Time Frame (Jul 2018 – Jan 2019)
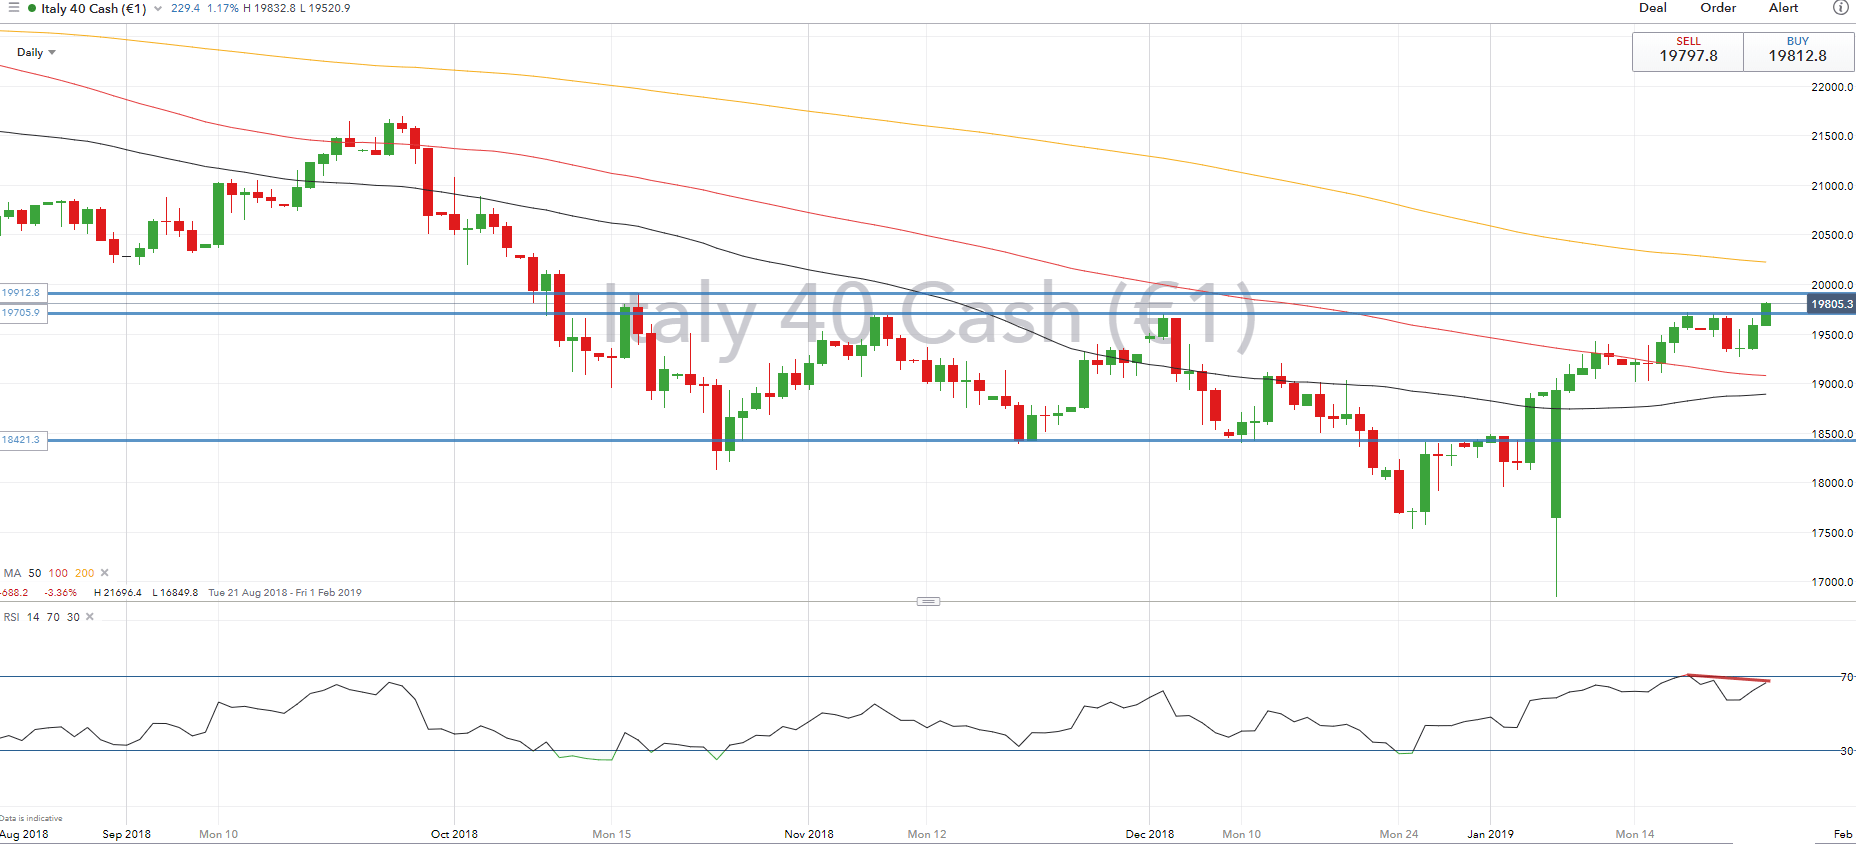
FTSE MIB | Bearish RSI Divergence Raises Scope of Pullback
FTSE MIB has breached the double top from the Nov/Dec highs, subsequently eyeing a move towards October 17th peak at 19910. However, scope for a pullback is on the horizon given the bearish RSI divergence formed on the daily timeframe.
FTSE MIB Price Chart: Daily Time Frame (Aug 2018 – Jan 2019)
--- Written by Justin McQueen, Market Analyst
To contact Justin, email him at Justin.mcqueen@ig.com
Follow Justin on Twitter @JMcQueenFX
Other Weekly Technical Forecasts:
Australian Dollar Forecast - AUD/USD, EUR/AUD, AUD/JPY Chart Support and Resistance Reinforced
Crude Oil Forecast - Sharp Rebound Appears Set To Continue
British Pound Forecast - Preparing For Further Upside?
US Dollar Forecast - Dollar Ends Week With Its Worst Drop in 4 Months, Still Not a Break


