


Australian Dollar Forecast
- Excluding GBP/AUD, Australian Dollar was little changed versus most of its major peers
- Critical near-term support and resistance areas were reinforced, prices seek breakouts
- I take a look at AUD/USD, EUR/AUD and AUD/JPY as we await their next big moves
Have a question about what’s in store for Australian Dollar next week? Join a Trading Q&A Webinar to ask it live!
AUD/USD Technical Outlook: Neutral
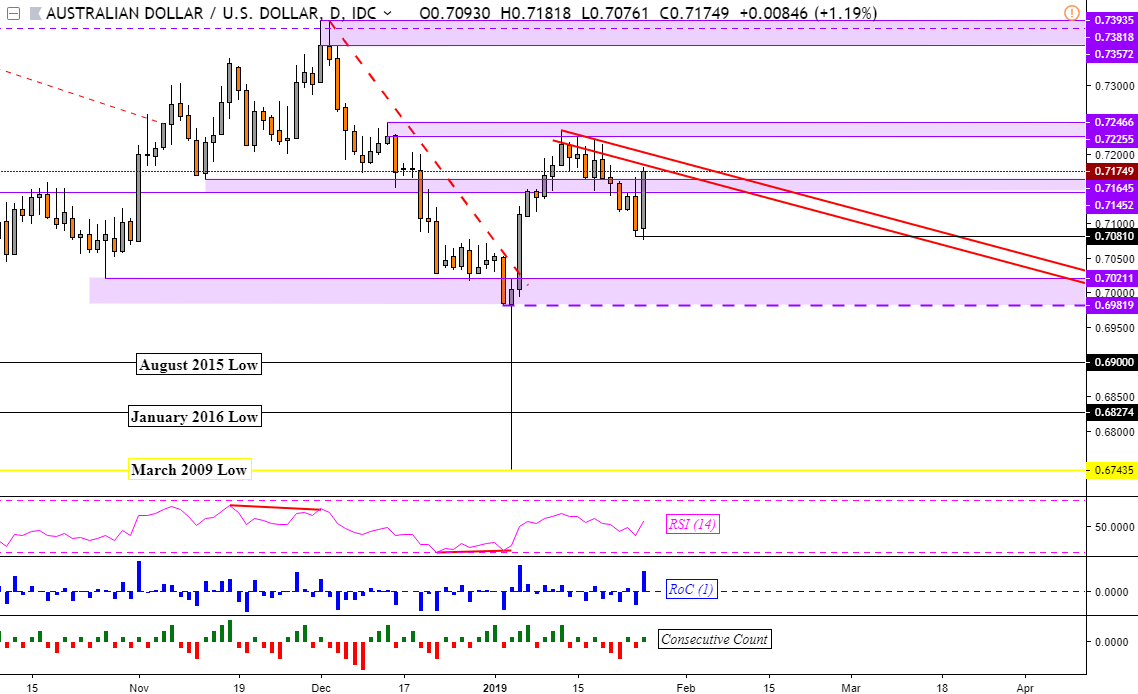
Last week, I noted how the Australian Dollar was carving out a bullish continuation pattern against its US counterpart. Since then, it has dissolved after a breakout to the downside. This was then followed by a respectable bullish push on Friday that essentially left AUD/USD close to little changed after 5 days.
Looking at the daily chart, Aussie Dollar appears to be stuck under a descending range of support. This is drawn via the two descending parallel red lines below. If prices climb above these in the week ahead, the pair still faces a horizontal range of resistance afterwards between 0.72255 and 0.72466.
Meanwhile, near-term support is a horizontal range in-between 0.71645 and 0.71452. It seems that the immediate areas of support and resistance pointed out last week were reinforced. If there is a turn lower, the next barrier may stop a descent at 0.7081. An upside push would leave the December 2018 highs in sight. With that in mind, the technical outlook looks neutral.
In this week’s poll, the top two popular picks to cover in addition to AUD/USD were EUR/AUD and AUD/JPY. You can participate in this vote each week by following me on twitter @ddubrovskyFX as well as to see timely updates on the Aussie Dollar.
AUD/USD Daily Chart
EUR/AUD Technical Outlook:Neutral
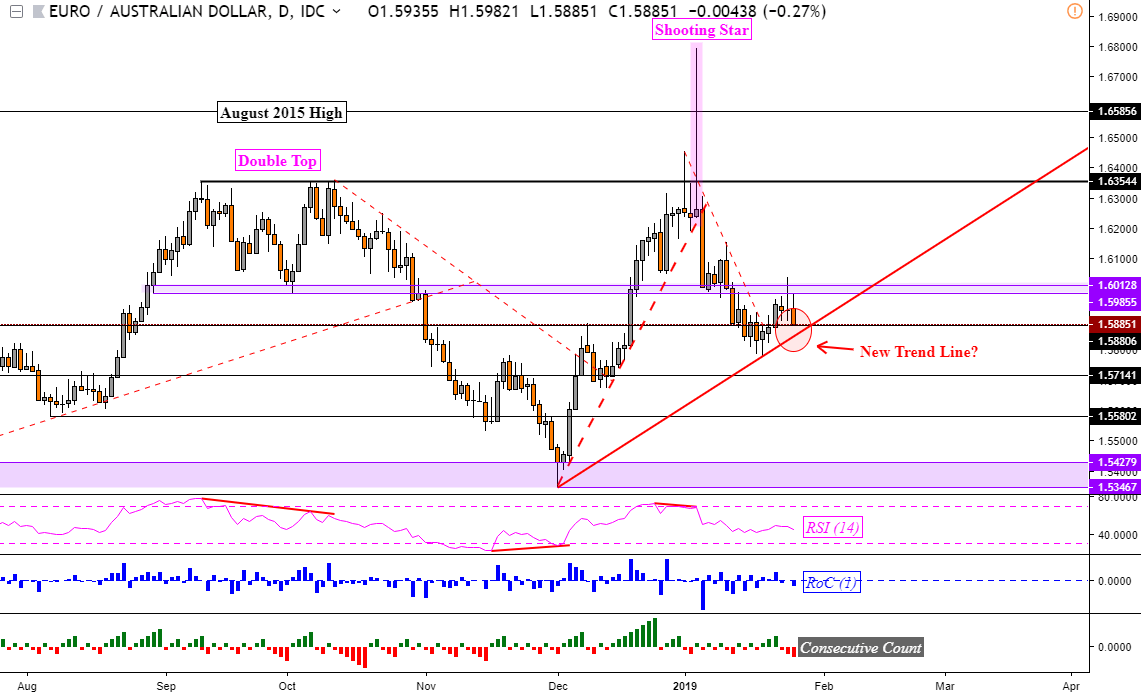
Like AUD/USD, EUR/AUD remains wedged between key areas of support and resistance. After a climb through a near-term falling trend line from the beginning of the year, EUR/AUD struggled maintaining upside momentum this past week.
A new rising trend line appears to be forming on the daily chart below. This is created via connecting the December lows with the January 18th one. Before reaching that support line, the pair needs to clear a former resistance line going back to June/July 2018 at 1.58806.
Meanwhile near-term resistance is a horizontal range between 1.59855 and 1.60128. Climbing through it opens the door to testing 1.63544. A descent through the rising support line on the other hand exposes 1.57141. The EUR/AUD technical outlook will look neutral.
EUR/AUD Daily Chart
AUD/JPY Technical Outlook: Neutral
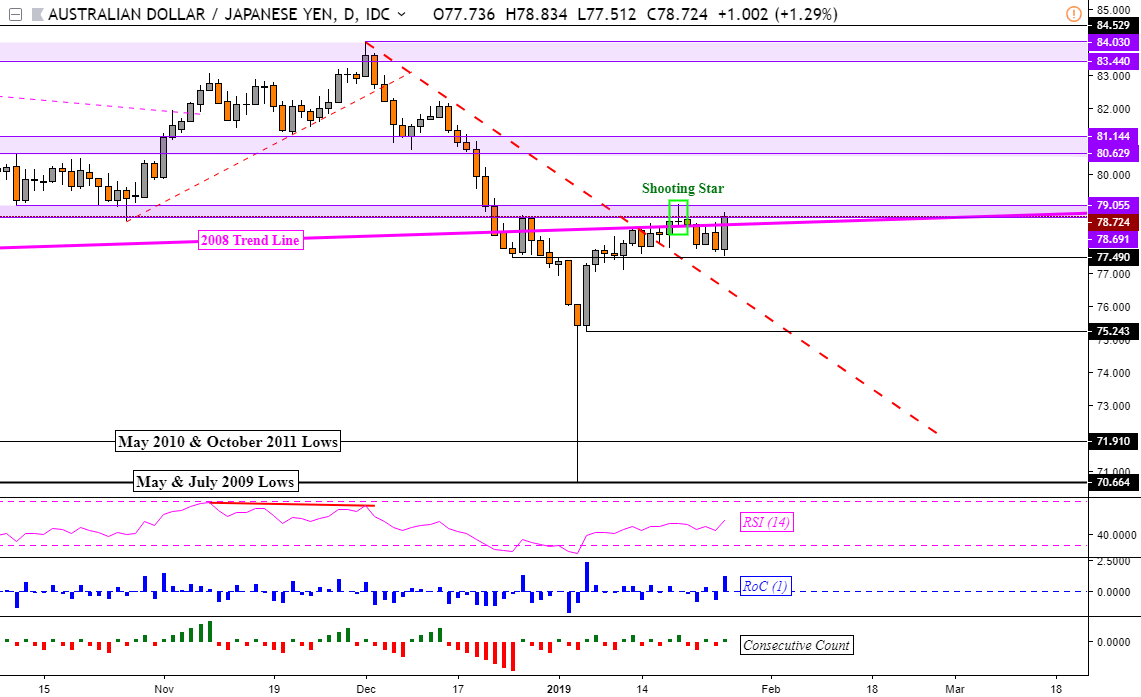
Previously, I outlined a shooting star candlestick in AUD/JPY which signaled indecision. The pair did descend after it was created which increased the chances of a bearish reversal. But, near-term resistance held at 77.49 and the pair climbed to finish the week little changed.
Even though the shooting star was overturned, prices remain under a horizontal range of resistance in-between 78.69 and 79.05. This area held as former support in September/October 2018 and appears to have turned into resistance.
Climbing through that barrier opens the door to testing 80.62 – 81.14. Should prices turn lower on the other hand, a fall through support would expose 75.24. As AUD/JPY struggles to pick a direction, the technical outlook will look neutral.
AUD/JPY Daily Chart
** Charts created in TradingView
--- Written by Daniel Dubrovsky, Junior Currency Analyst for DailyFX.com
To contact Daniel, use the comments section below or @ddubrovskyFX on Twitter
Looking for a fundamental perspective on Australian Dollar? Check out the Weekly AUD Fundamental Forecast.


