


Talking Points:
- The DXY Dollar Index suffered its biggest single-day loss in nearly four months on Friday
- Whether the DXY, and equally-weighted index or EURUSD, the Greenback is still in congestion
- See the 1Q 2019 fundamental and technical forecast for the Dollar updated on our trading guides page
Looking for a fundamental perspective on US Dollar? Check out the Weekly USD Fundamental Forecast.
Technical Forecast for US Dollar: Bearish
Finally, some signs of life from the benchmark currency this past week. The Dollar started off the period innocuously enough with the same degree of extreme quiet we have started to grow acclimated to these past weeks. However, a jolt of volatility arose through the Thursday/Friday period. An initial rally from the currency technically cleared short-term resistance that stretched back to the highs set in mid-December. Yet, in familiar fashion given our recent market conditions, this would not translate into meaningful follow through – even though the move would only push it deeper into range. The effort was snuffed out Friday with the biggest single-day drop since November 1 with an approximate 0.8 percent slide that puts it among some of the sharpest losses we have seen over the past years. Yet, as impressive as that singular performance was, it offers little guarantee of a deeper intent. Support in the DXY in the convergence of channel support back to May and the 200-day moving average falls presently at 95.20. First, we need to get to that floor before we can prepared for a break. It is certainly possible to achieve, but it will require a greater level of intent. If we do not see momentum build behind the Dollar bears and further key breaks amongst the majors, the range will be difficult to overcome and any tentative clearance will likely sputter before a trend even starts.
Chart DXY Dollar Index with 200-Day Moving Average and 1-Day Rate of Change (Daily)

Periods of unusual quiet inevitably normalize – just as periods of excess activity will settle. We saw that truism at work this past week. Below we have a ratio of volatility over a short period of time relative to a longer period. The ratio is for the 5-day ATR (average true range) relative to the 20-day. That is one trading week relative to one trading month. When the reading drops it insinuates a slowing in activity levels relative to what we had seen previously; so the tumble to the ratio to its lowest level since December 2016 reflected on a remarkable downshift in conditions. That is remarkable given that we are wading deeper into the year’s liquidity and the range of high profile fundamental issues has grown more extensive and problematic. With the activity over the second half of the week, we have eased back from some of the extreme, but we are not yet back into trend-oriented form. If markets are more suited to range trading, that is something that can be taken advantage of. However, recognition of skulking bouts of volatility like we have seen this past week make such a passive strategy a dangerous notion. Patience for the eventual break and clarity of trend may be the preferred option for those not tolerant to higher levels of uncertainty and risk.
Chart DXY Dollar Index with Ratio of 5-Day to 20-Day ATR (Daily)

Looking into the majors, the DXY’s principal component shows much the same lack of commitment as the aggregate index itself. EURUSD made a bid to break its own short-term support with a slide through 1.1350 only to suddenly reverse course before it could make it to November’s swing low of 1.1215. In fact, it wouldn’t even make it to a more measured range low of 1.1275. While it is possible for the Dollar to make a progressive move without EURUSD offering an affirmative signal itself (should the Euro rally strongly at the same time the Dollar does, or if they both drop sharply in tandem), but to see such significant movement in concert is a lower probability scenario. That said, traders should keep tabs on 1.1575 (January’s swing high and the 200-day moving average) as well as 1.1215. If we are pressuring either, the stakes are high enough to warrant breakout planning.
Chart EURUSD (Daily)

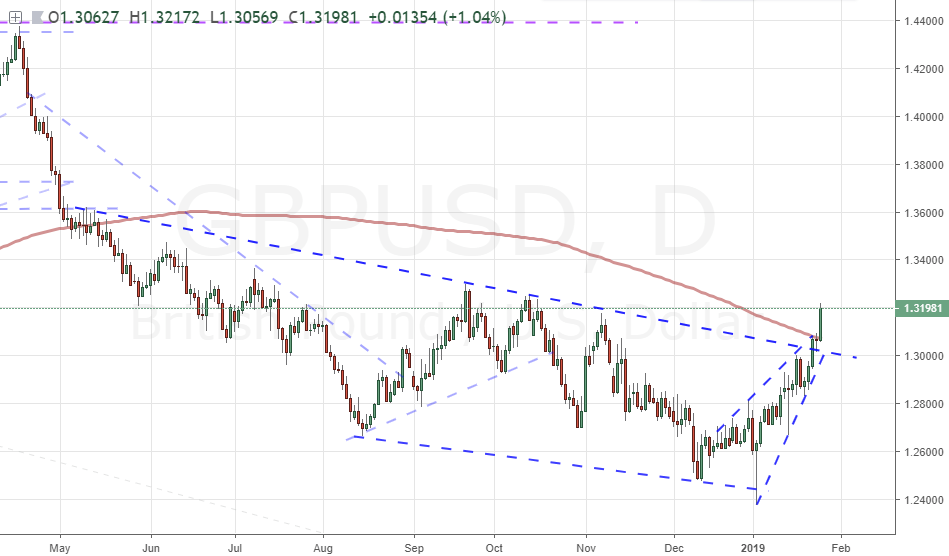
Not all Dollar-based majors are as stuck in the technical mud as EURUSD. Remarkably, the Brexit-burdened GBPUSD actually leveraged a remarkable bullish breakout of its own this past week – largely the Sterling’s doing. Having broke above 1.3000, the pair cleared trendline resistance that has ushered the market lower since May. With Friday’s leg of the effort, Cable’s 200-day moving average gave way at 1.3070. There is more volatility to be found amongst other majors like NZDUSD, USDCAD and USDCHF; but is that enough to leverage the single currency to a systemic, self-generating trend? That remains to be seen. However, just because EURUSD is treading water, doesn’t mean the Greenback cannot draw motivation to more significant trend if its own major counterparts contribute.
Chart of GBPUSD and 200-Day Moving Average (Daily)
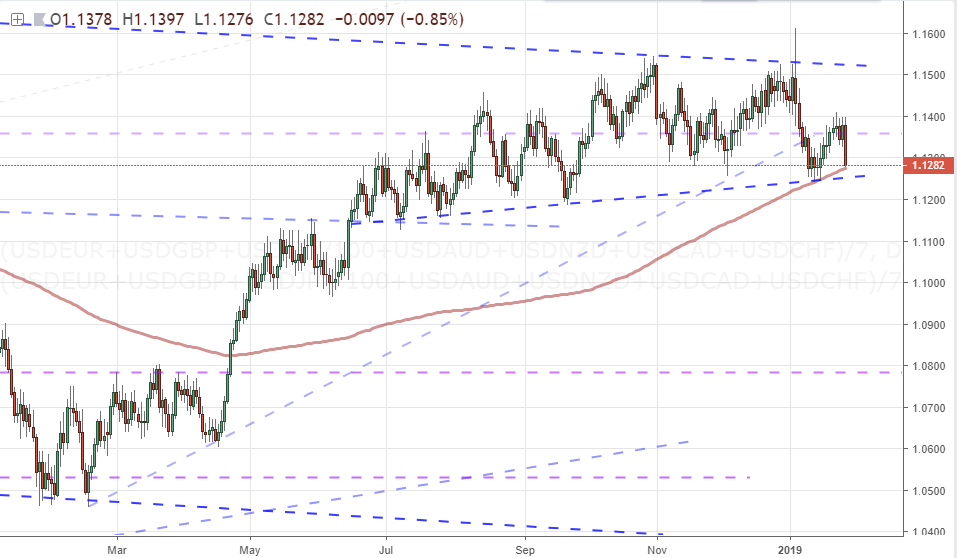
With the other Dollar pairs in mind, we should consider an equally-weighted Dollar index below. This is comprised of the seven most liquid majors and doesn’t deviate too far from the sentiment of restraint that we find in the DXY. However, the proximity to a transition is far more pressing. Trendline support is at hand immediately in this chart. The 200-day moving average isn’t exactly the line in the sand that it would be in an official exchange rate, but its relative tipping point quality should be considered nonetheless. As further pairs reach – and break – their individual Dollar support levels, this broad shift for the Greenback grows more likely.
Chart of Equally-Weighted Dollar Index and 200-Day Moving Average (Daily)
Since we still don’t have the CFTC’s Commitment of Traders (COT) reporting on speculative futures positioning owing to the government shutdown (which has been temporarily lifted as of Friday), we will look at retail positioning which has a quality of being short-term focused and more volatile. Positioning in the EURUSD exchange rate took a dramatic reversal intraweek from the highest net long position we have seen months to a near-balanced exposure in the span of days. The unwind of a heavy long exposure was the principal motivation for the flip, but there was some speculative short interest that increased as well. Volatility attracts speculative interests, so as activity levels pick up, make sure to keep a close eye on retail positioning on the DailyFX Sentiment page.
Chart of Retail Positioning in EURUSD (Daily)


Other Weekly Technical Forecasts:
Australian Dollar Forecast - AUD/USD, EUR/AUD, AUD/JPY Chart Support and Resistance Reinforced


