


Talking Points:
- The British Pound continues to benefit from optimism over a ‘soft Brexit’ deal being reached.
- The worst performing GBP-crosses remain GBP/AUD and GBP/NZD amid a global rebound in higher yielding currencies and risk-correlated assets.
- Retail trader positioning points to choppy trading for GBP/USD in the days ahead.
See our long-term forecasts for the British Pound and other major currencies with the DailyFX Trading Guides.
Technical Forecast for the British Pound: Neutral
The British Pound was a top performing currency last week, continuing to be fueled over optimism that a ‘soft Brexit’ deal will eventually be reached. Concurrently, with the US midterm elections in the rearview mirror, global equity markets returned to rally mode, allowing higher yielding currencies and risk-correlated assets to perform well. GBP/CAD and GBP/JPY were the top performing pairs, up by +0.79% and +0.57%, respectively. On the other end of the spectrum, the only two GBP-crosses to lose ground last week, GBP/AUD and GBP/NZD, fell by -0.44% and -1.13% each.
Even as the British Pound has outperformed its contemporaries in recent weeks, there’s no legitimate reason for gains besides hoping for a ‘soft Brexit’ deal emerging. Progress has been uneven to say the least, and so while many GBP-crosses may be in the clear at present time, it’s worth handicapping any expectations with the pragmatic understanding that directional moves could be reversed upon unexpected news flow.
GBP/USD Price Chart: Daily Timeframe (August 2017 to November 2018) (Chart 1)
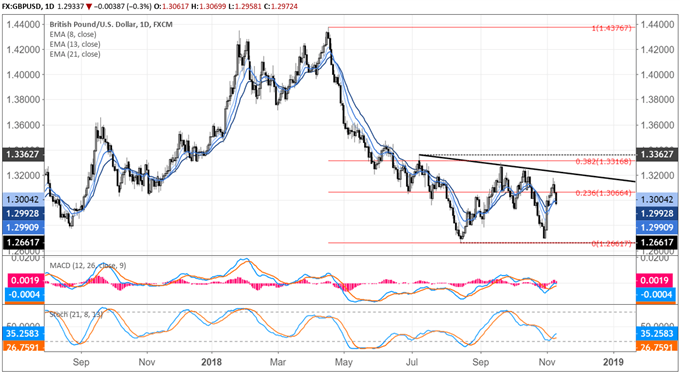
GBP/USD only finished down by -0.02% last week, but not before an earnest attempt higher; a weekly inverted hammer has formed as a result of the failed upside move. Concurrently, price failed to move back above the 23.6% Fibonacci retracement of the 2018 year-to-date range at 1.3066. Taking a step back, it appears that a descending triangle may have been forming since July, leaving GBP/USD in the middle of the consolidation. Add in the fact that price is below its daily 8-, 13-, and 21-EMA envelope as the envelope is sloping higher, and it’s evident that there’s no clear direction at present time, a poor environment for momentum or breakout strategies. Even if more consolidation is due for the foreseeable future, being in the middle of the range makes it an inopportune time for range traders to get involved either.
GBP/JPY Price Chart: Daily Timeframe (May 2017 to November 2018) (Chart 2)
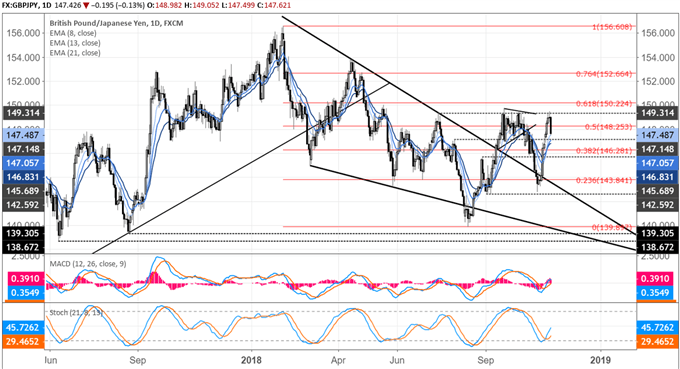
GBP/JPY has easily been the most sensitive pair to Brexit news in recent weeks, and perhaps one of the few pairs with any clarity on the technical front. Price remains above its daily 8-, 13-, and 21-EMA envelope, and the moving averages are now in sequential order (a week ago, they were not). Both daily MACD and Slow Stochastics have turned higher above their respective signal or neutral lines, thanks to GBP/JPY trading back up to the September highs in the process. If more gains are to come, then the September 21 high, the bearish outside engulfing bar at 149.72 needs to be cleared out first.
EUR/GBP Price Chart: Daily Timeframe (August 2017 to November 2018) (Chart 3)
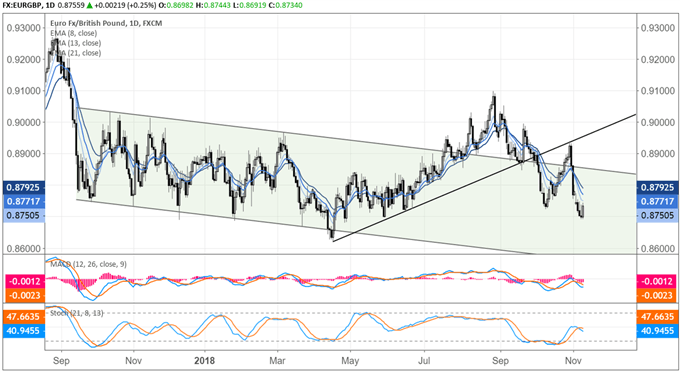
EUR/GBP is another GBP-cross that has seen prices swing sharply in recent weeks, but the main thrust remains lower at present time. EUR/GBP is back in its descending channel dating back to last September, aftertThe rally at the end of October failed to retake the trendline from the April, May, and June lows. Similarly, reinforcing the bearish profile, a head & shoulders topping pattern formed between July and September is in the process of being worked through. Insofar as price remains below its daily 8-, 13-, and 21-EMA envelope while both daily MACD and Slow Sltochastics trend lower in bearish territory, EUR/GBP’s path of least resistance is lower at present time.
FX TRADING RESOURCES
Whether you are a new or experienced trader, DailyFX has multiple resources available to help you: an indicator for monitoring trader sentiment; quarterly trading forecasts; analytical and educational webinars held daily; trading guides to help you improve trading performance, and even one for those who are new to FX trading.
--- Written by Christopher Vecchio, CFA, Senior Currency Strategist
To contact Christopher, email him at cvecchio@dailyfx.com
Follow him in the DailyFX Real Time News feed and Twitter at @CVecchioFX.


