


GBPUSD Technical Highlights, Prices and Analysis
- GBPUSD touches a six-week high.
- Five Higher Lows in a row boosts sentiment.
- Reverse Head and Shoulders breakout on the daily chart.
We have recently released our Q3 Trading Forecasts for a wide range of Currencies and Commodities, including GBPUSD with our fundamental and medium-term term technical outlook.
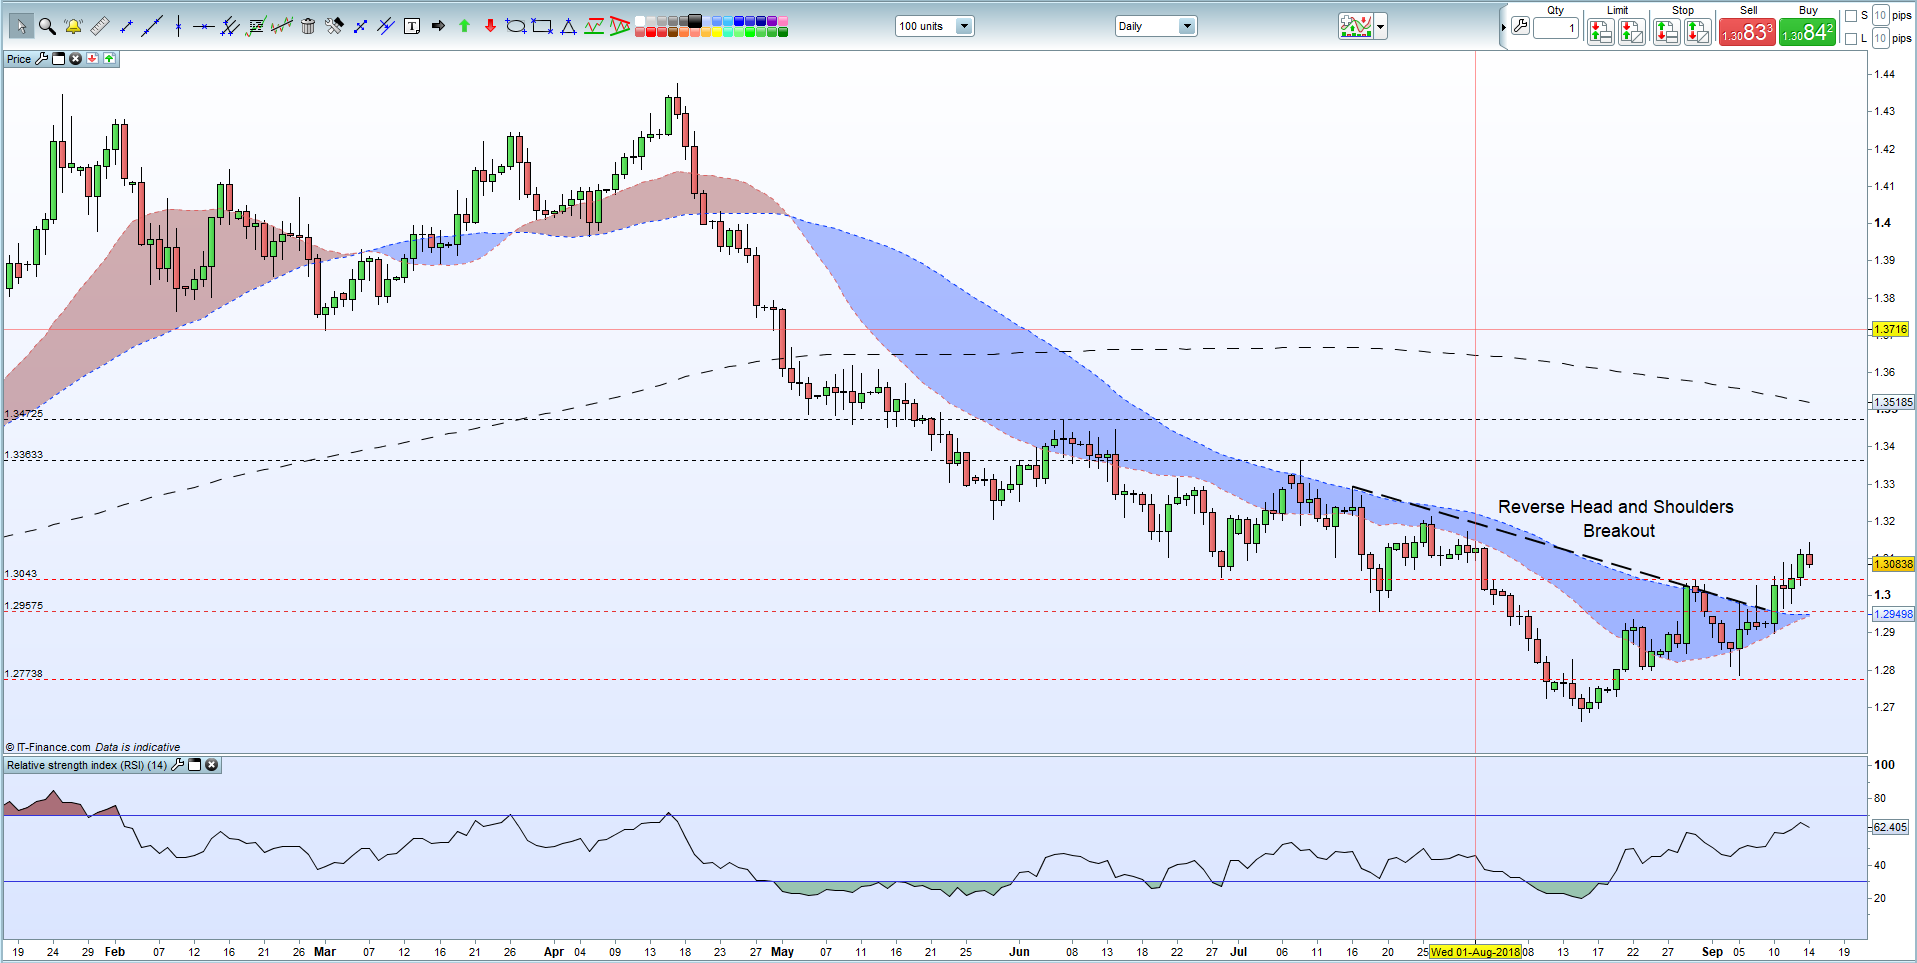
Daily GBPUSD Chart Remains Positive Above 1.30250
A reverse head and shoulders break out at the start of the week left GBPUSD free to run higher with the pair printing a fresh six-week high at 1.31440 on Friday morning. The week’s price action saw the pair establish five higher lows in a row and move above the 20- and 50-day moving average for the first time in over two weeks. Upside targets are now the July 26 high at 1.32135 ahead of the July 16 ‘shoulder’ at 1.32932.
A break of the latest higher low at 1.30250 should be watched for which would open the way to the 20- and 50-day crossover around 1.2950. The psychological 1.3000 level should also see buyers appear.
GBPUSD Daily Price Chart (January - September 14, 2018)
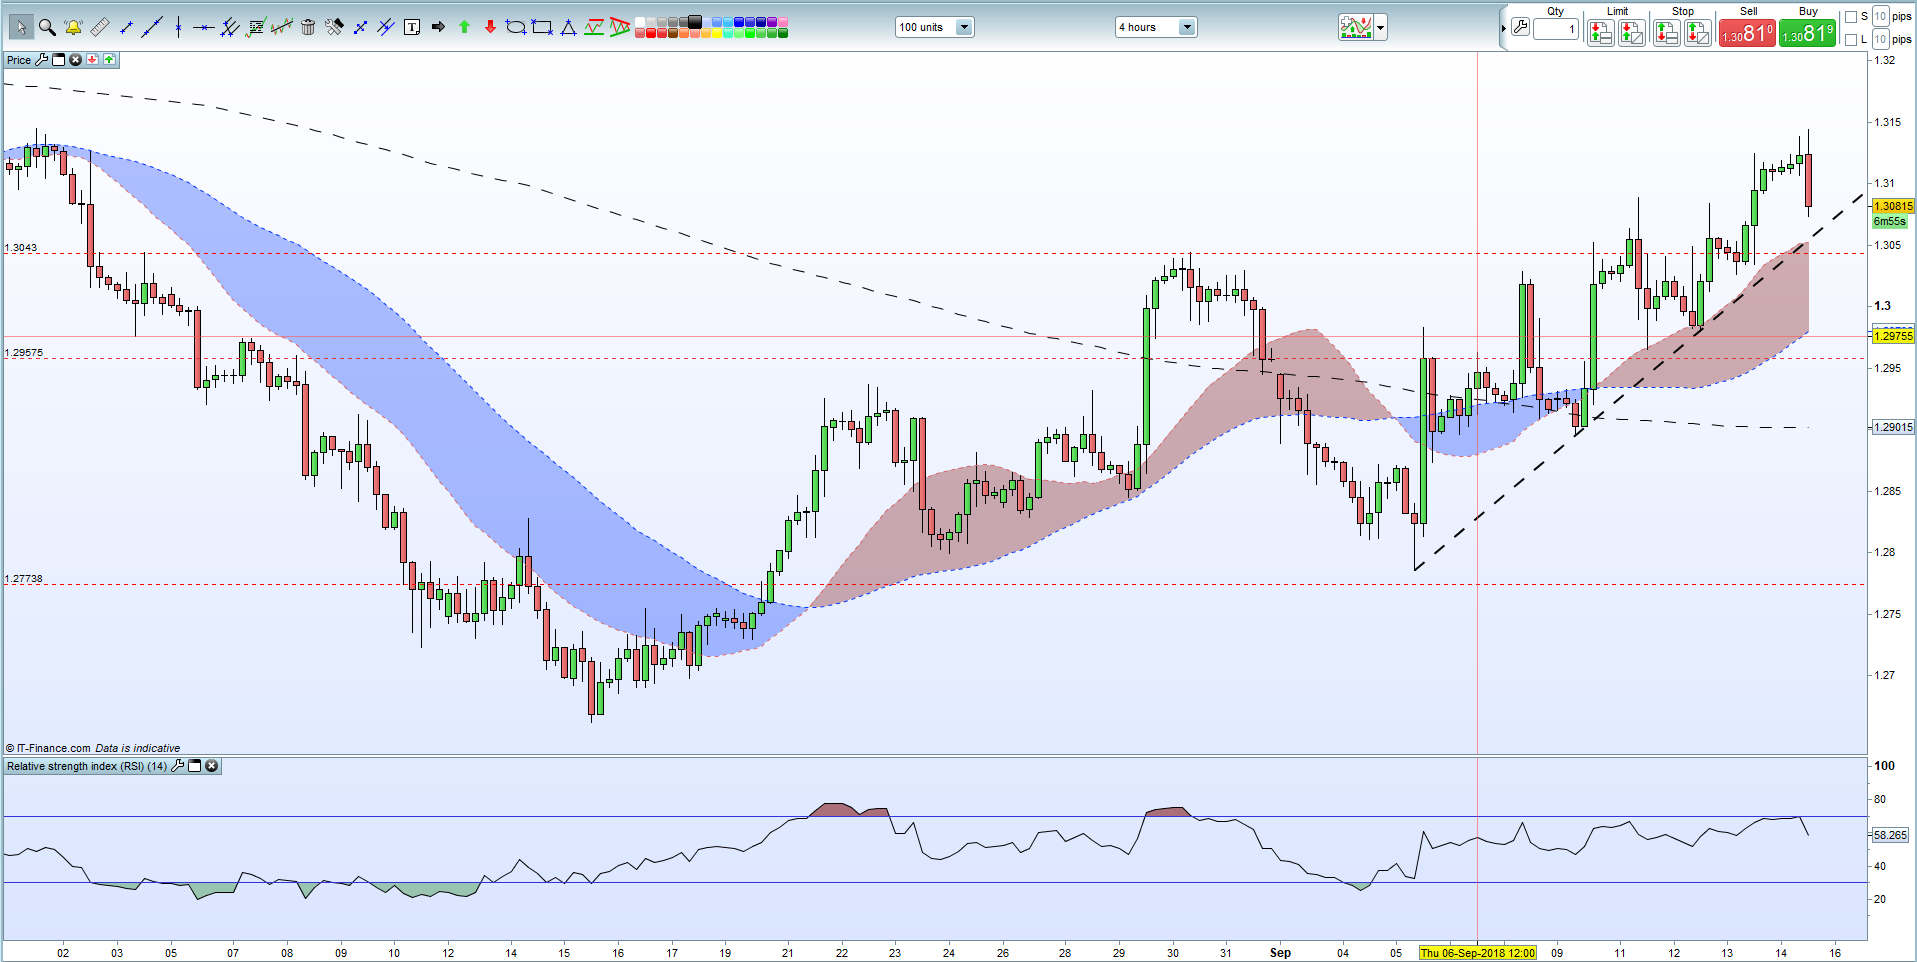
Four-Hour Chart – Uptrend Remains in Place
The bull trend, starting from the September 5 low at 1.27856 remains in place but price action late-Friday is challenging this. The chart shows a confluence of technical levels around 1.3040-1.3050 including the breakout line, the 20-day moving average and the August 30 swing high at 1.3044, and these should provide short-term support.
GBPUSD Four Hour Price Chart (August 1 – September 14, 2018)
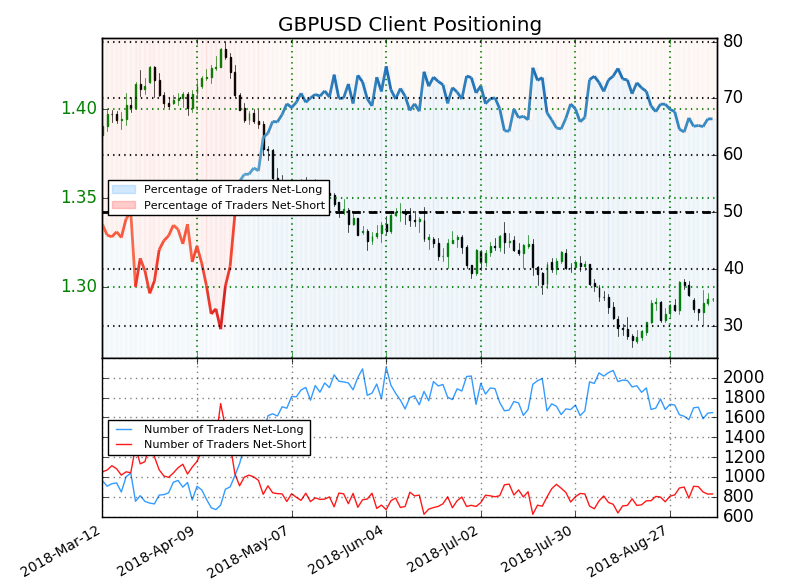
GBPUSD Client Sentiment – A Bullish Impulse
The IG Client Sentiment Indicator shows us that retail are 60.6% long of GBPUSD and that traders are less net-long on a daily and weekly basis. Recent changes in sentiment warn that GBPUSD may soon reverse higher despite the fact traders remain net-long.
DailyFX has a vast amount of resources to help traders make more informed decisions. These include a fully updated Economic Calendar, and a raft of constantly updated Educational and Trading Guides
--- Written by Nick Cawley, Analyst
To contact Nick, email him at nicholas.cawley@ig.com
Follow Nick on Twitter @nickcawley1
Other Technical Forecast:
Australian Dollar Forecast: AUD/USD Breakout Struggles, EUR/AUD Risks Reversing to August Lows


