


Equities Talking Points:
- S&P 500 and Dow Technical Outlook Remains Bullish Until Proven Otherwise.
- Dow Jones Pulls Back to Near-Term Support After Seven-Month Highs.
- Are you looking for longer-term analysis of Equity prices? Check out our Quarterly Forecasts as part of the DailyFX Trading Guides.
Equity Themes Continue to Build as End of Q3 Nears
Global stocks have continued to display interesting volatility this week, coming on the heels of some rather aggressive sell-offs that had begun to show in the European equity space. Coming into September, we looked at potential break-down scenarios in the DAX and the FTSE. Both of those indices witnessed various forms of pressure coming into this week, but a bit of support has started to show and price action has put in a mild bounce as we near the close of this week.
Below, we go through five equity indices to look at the technical backdrop behind each as we move towards the end of Q3. And I saved what might be the most interesting setup across global equities for the fifth market that we investigate.
S&P 500 Pulls Back Shy of the August High
While the Dow Jones Industrial Average has been able to punch up to a fresh seven-month high, the S&P 500 remains inside of the highs set just last month. There is a bit of difference in the context around these moves, however, as the S&P 500 set a fresh all-time high in August while the Dow remains below the levels that were traded at in January. Nonetheless, each index would offer a similar bullish backdrop until some evidence of breakdown or deviation of the topside trend begins to show.
The forecast here will be set to bullish, and pullbacks to areas of potential support around could be investigated for bullish exposure. On a short-term basis, the area around 2883 could be of interest for topside approaches; and a bit deeper around the 2860 level we have another area of potential support.
S&P 500 Outlook: Bullish
S&P 500 Daily Price Chart
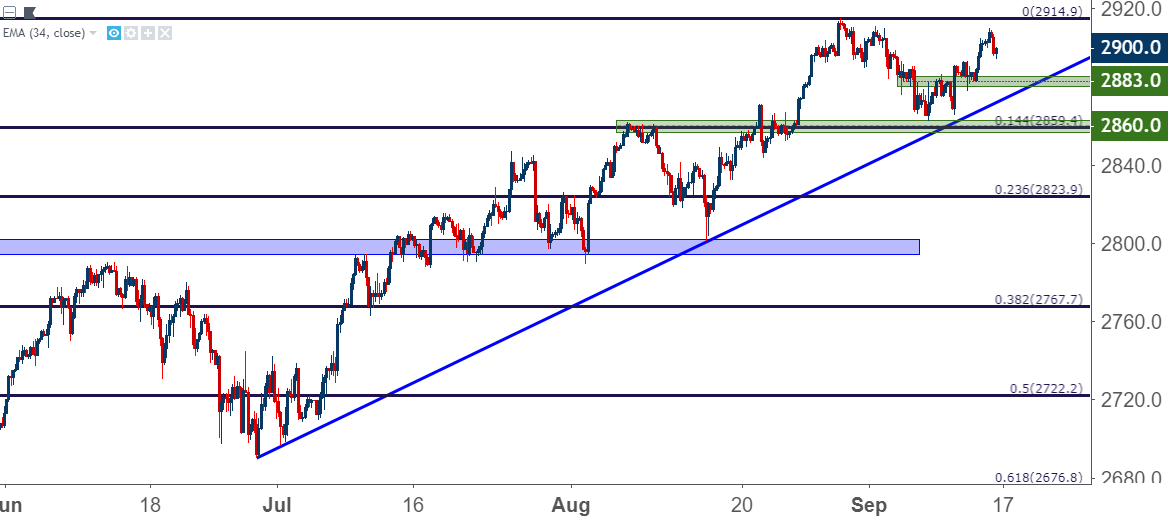
Chart prepared by James Stanley
Dow Tests Short-Term Support After Friday Pullback
We looked into this one with a little more depth earlier this morning. While the S&P 500 set a fresh all-time high in August, the Dow continues to drive towards the high watermark that was set in January of this year. This doesn’t make the recent bullish push that’s held since the beginning of July any less attractive, however, and the door appears to remain open for topside continuation here as well.
What we did get in the Dow earlier this week was a fresh seven-week high. Prices have started to pullback from that high as a report has begun to circulate ahead of the weekend that indicates that President Trump has ordered his aides to proceed ahead with the $200 billion in tariffs to China. This could potentially draw a deeper pullback into the index, and as we looked at earlier, the first area to investigate for support as driven by aggressive approaches would be just above that 26k area. A bit deeper, we have another area of potential support around this week’s swing low of 25,759; and below that, at 25,500, a third area of prospective support exists.
Dow Jones Outlook: Bullish
Dow Jones Four-Hour Price Chart: Can the Bull Continue to Charge Ahead?
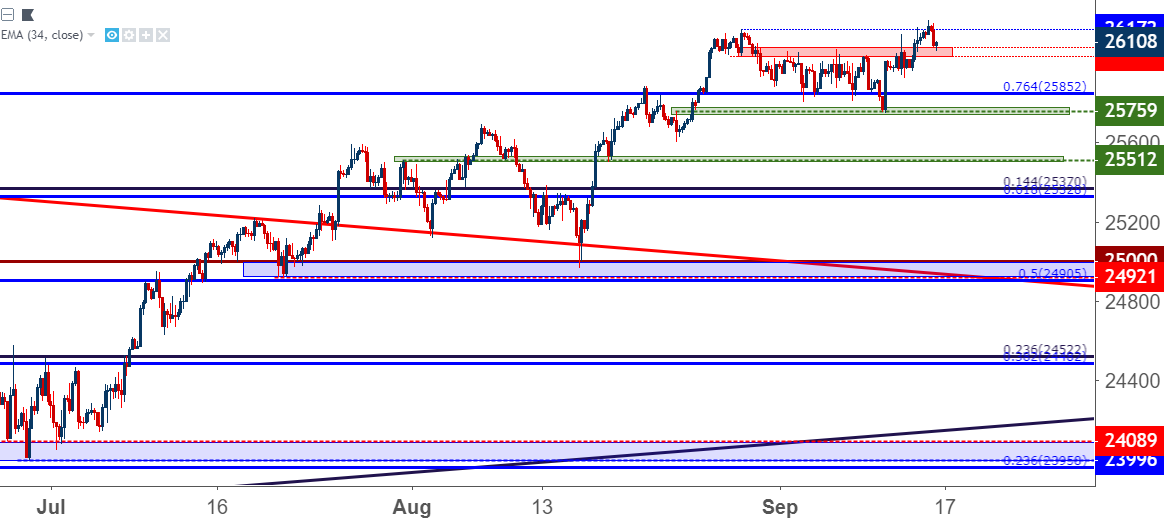
Chart prepared by James Stanley
DAX Finds Support After a Rocky Start to September
Coming into the month, we looked at the build of a bearish setup in the DAX, as prices had just started to budge below the bullish trend-line that connects the lows since the 2016 open. Weekly price action had even printed as a shooting star, showing a respectable response from sellers; and that weakness continued through last week and into this week’s open. We’ve had a bit of support show ahead of the prior 2018 low. This takes place at the 38.2% Fibonacci retracement of the two-year move in the index.
DAX Outlook: Bearish
DAX Weekly Price Chart (Logarithmic)
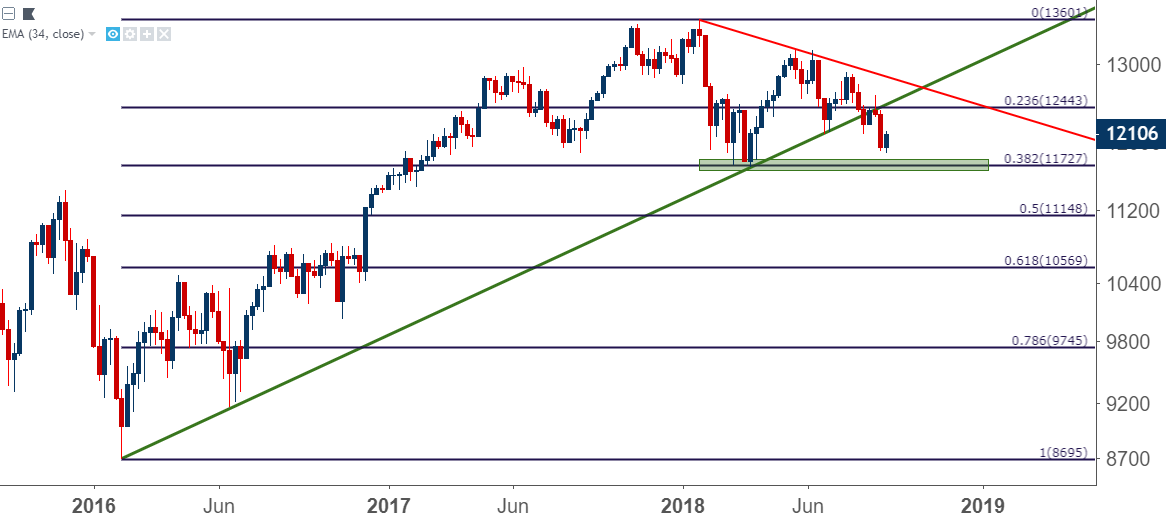
Chart prepared by James Stanley
On a shorter-term basis, the door may still be open for further bearish continuation. This week’s bounce has seen prices elevate back-towards prior points of support, and short-term resistance has held within the 50-point range that runs from 12,105 up to 12,155. Notable, however, is the fact that this resistance has held throughout this week’s ECB rate decision; and the forecast here will remain at bearish until prices print above the swing-high at 12,249.
DAX Four-Hour Price Chart: Resistance at Prior Support Holds Through ECB
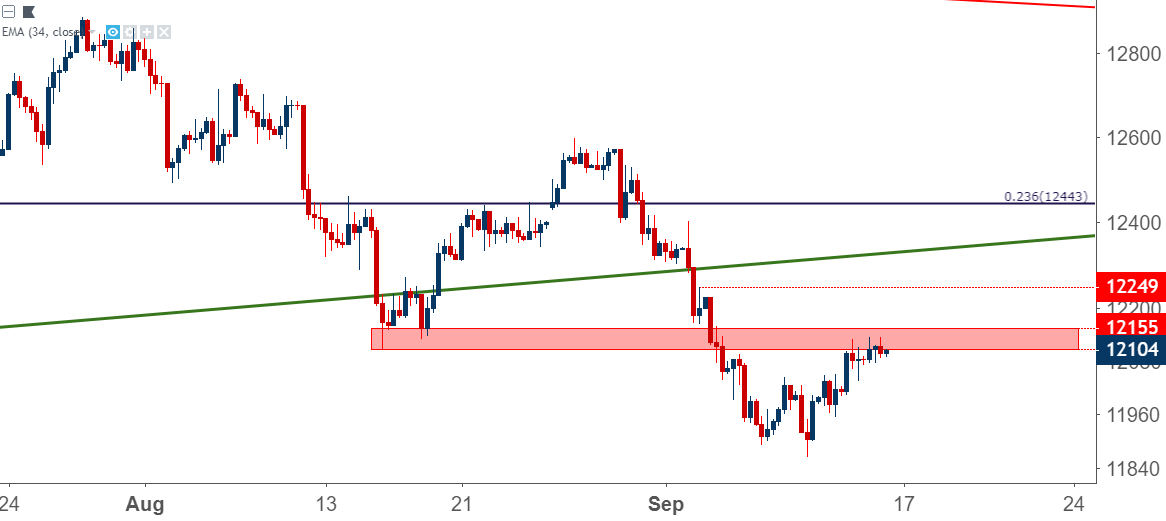
Chart prepared by James Stanley
FTSE 100 Bounces After a Brutal September Open
We had similarly looked at bearish setups in the FTSE coming into the month of September, as signals had begun to pile up that a downside move may be near. We didn’t have to wait long for that to come to fruition, and leading into this week the index remained in a rough spot. We were looking for prices to move-down to test the 50% marker of the March-May major move; but prices fell even beyond that level until eventually finding a bit of support at the 61.8% marker of that same Fibonacci study.
FTSE Daily Price Chart: FTSE Finally Finds Fibonacci Support After a Brutal September Open
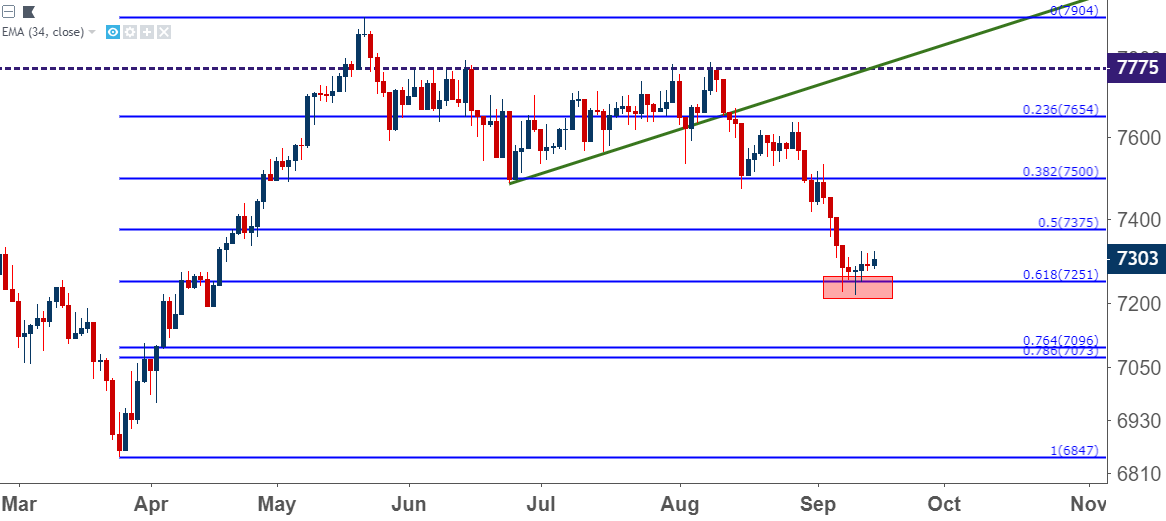
Chart prepared by James Stanley
At this stage, both the short and long side of the index present challenges. While that prior trend was fairly strong and may have more room to run, we saw a respectable build of price action support at that Fibonacci level that should not be summarily discounted.
We’re currently seeing a bit of short-term resistance off of the 14.4% retracement of the August-September sell-off, but this may not be enough to furnish motivation for sellers. A bit higher, however, we have case of confluence, taken from the 23.6% marker of the recent move combined with the 50% marker of the longer-term study looked at above. This runs from 7354 up to 7375, and resistance showing here could re-open the door to short-side exposure setups.
FTSE Outlook: Bearish
FTSE Four-Hour Price Chart: Lower-High Resistance Potential
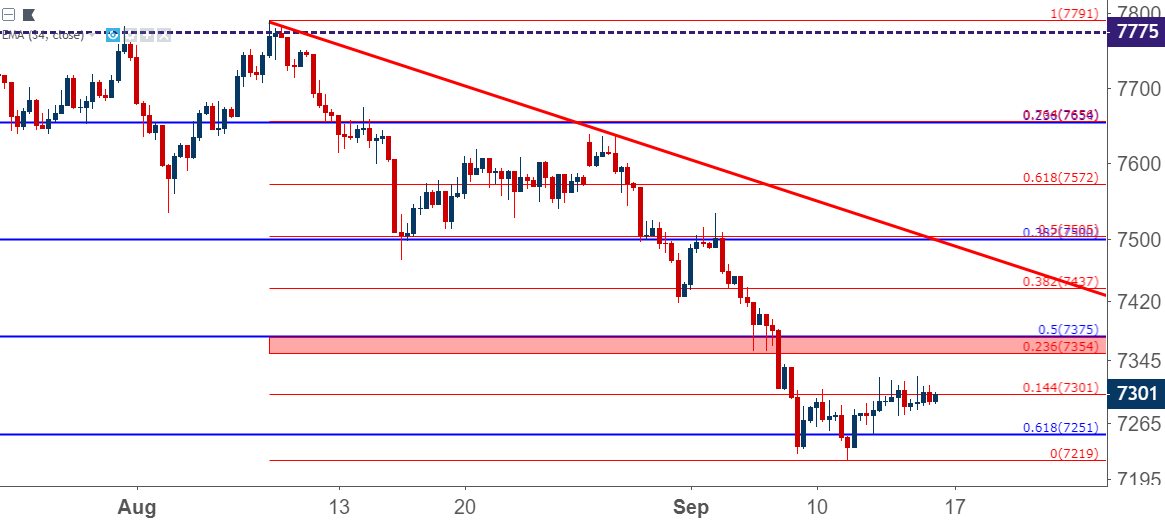
Chart prepared by James Stanley
Nikkei: The Ascending Triangle Plays, Now What?
I’ve saved the most interesting setup for last.
Coming into September we looked at an ascending triangle formation in the Nikkei utilizing some very long-term levels. The area around 22,946 is especially pertinent, as this is the 50% marker of the 28-year major move in the index, taking the high from 1990 down to the 2008 Financial Collapse lows.
Nikkei Monthly Price Chart: Continued Tests Around the 50% Marker
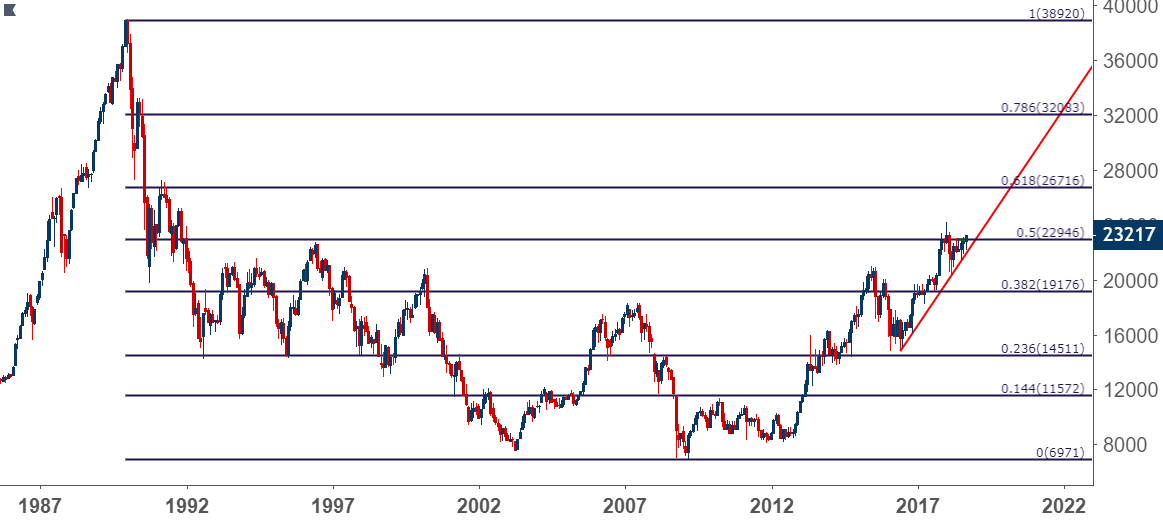
Chart prepared by James Stanley
More interesting, however, is how this level had helped to build resistance in the index throughout this summer, with multiple topside tests failing upon retests of this resistance. But – on the other side of price action, bulls had been coming in at progressively higher lows, leading to the ascending triangle formation that we looked at last week. This formation will often be approached with a bullish bias, and that’s precisely what we looked at coming into September.
Today brings a breakout from this resistance level as the Nikkei is now trading at fresh seven-month highs. Given the early stage of the breakout, there’s not really much that can be done at this point. Traders not yet long can look for higher-low support to show around that prior area of resistance; and given that its less than 300 points away, that possibility certainly remains as we move into next week.
The forecast here will remain at bullish.
Nikkei Outlook: Bullish
Nikkei Daily Price Chart: Fresh Highs After Breakout from Ascending Triangle Formation
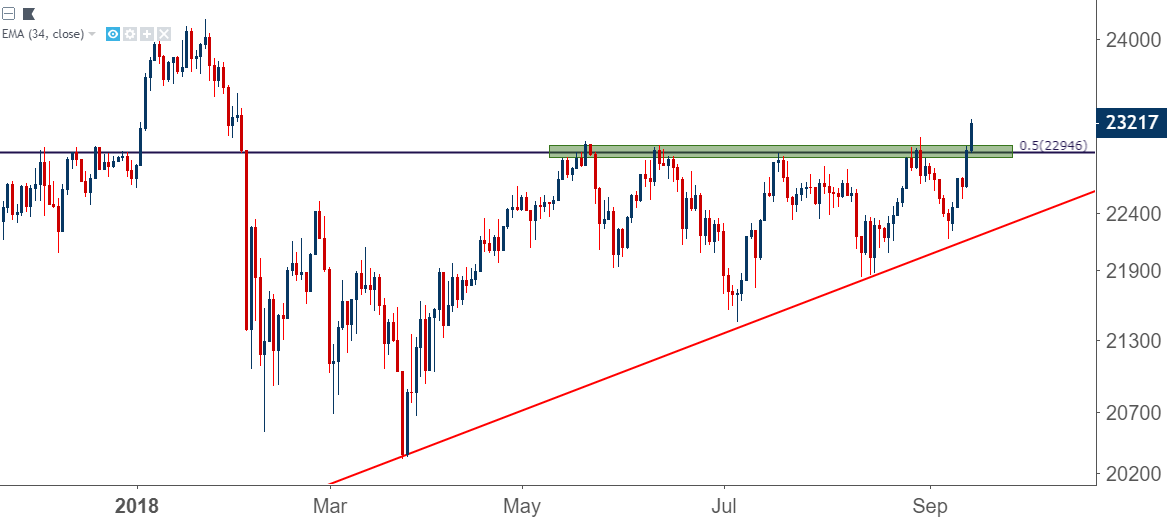
Chart prepared by James Stanley
To read more:
Are you looking for longer-term analysis on the U.S. Dollar? Our DailyFX Forecasts for Q1 have a section for each major currency, and we also offer a plethora of resources on USD-pairs such as EUR/USD, GBP/USD, USD/JPY, AUD/USD. Traders can also stay up with near-term positioning via our IG Client Sentiment Indicator.
Forex Trading Resources
DailyFX offers a plethora of tools, indicators and resources to help traders. For those looking for trading ideas, our IG Client Sentiment shows the positioning of retail traders with actual live trades and positions. Our trading guides bring our DailyFX Quarterly Forecasts and our Top Trading Opportunities; and our real-time news feed has intra-day interactions from the DailyFX team. And if you’re looking for real-time analysis, our DailyFX Webinars offer numerous sessions each week in which you can see how and why we’re looking at what we’re looking at.
If you’re looking for educational information, our New to FX guide is there to help new(er) traders while our Traits of Successful Traders research is built to help sharpen the skill set by focusing on risk and trade management.
--- Written by James Stanley, Strategist for DailyFX.com
Contact and follow James on Twitter: @JStanleyFX
Other Technical Forecast:
Australian Dollar Forecast: AUD/USD Breakout Struggles, EUR/AUD Risks Reversing to August Lows


