


Ichimoku Technical Analysis Focus:
- The ONE Thing: JPY strength. When looking at the Ichimoku dashboard that has been plugged with an hourly or intraday price feed, most pairs show an aggressive JPY strength bias that may mean either a period of risk-off sentiment is on the horizon that would lead to lower equity prices or currently weak FX may have further to fall
- Strong moves lower by GBP, EUR continue at the start of May as EUR/USD fell below the 233-DMA for the first time in a year and the US Dollar Index recently broke to the highest levels since late December.
- Introduction & explanation of Ichimoku Scorecard so that you can get the highest and best use with this information in your FX trading.
Something appears amiss to the equity market bulls out there. That something is JPY strength emerging as a dominant theme as well as the FX risk-sentiment bell weather, Australian Dollar.
Additionally, if looked at on a 5-day %change basis, EUR is the weakest G8 currency with the daily chart closing below the 61.8% Fibonacci retracement and its 233-day moving average for the first time in a year.
Aside from USD/JPY, given US Dollar’s strength (written about in depth here), the JPY is strengthening across the board on the hourly chart when Ichimoku is applied.
In other words, the dashboard is showing bearish signals across the board for the following crosses:
The Ichimoku dashboard was designed to help you separate the signal from the noise so that you can see and act quickly on important market developments. Intraday data with hourly chart price points are pumped in so you can see what trends have developed or that may be worth considering now.
Want a full (& FREE) guide to walk you through Ichimoku? I created one here
Intraday Ichimoku Scorecard – May 8, 2018

Data source: Bloomberg
The left third of the dashboard is where attention should be drawn. In short, it is showing you the output to see what components of Ichimoku are providing signals when utilizing hourly data.
Here’s a breakdown of the Ichimoku Dashboard Measuring Points:
Stature: Is the last price (LAST) above the current time cloud (LEAD 1), if so, Bullish. If not, Bearish.
Momentum: Is the lagging line (current price) below the price from 26-periods ago (LAG TIME PRICE), if so, Bullish. If not, Bearish.
Mid-Points: Is the Tenkan-Sen > Kijun-Sen, if so, Bullish. If not, Bearish.
Kumo: Is fast cloud (LEAD 1) above slow cloud (LEAD 2), if so, Bullish. If not, Bearish.
Future Kumo: Is futurefast cloud (LEAD 1 26) above slow cloud (LEAD 2 26), if so, Bullish. If not, Bearish.
US Dollar Strength Gets Spotty
While US Dollar strength has surprised many traders, a technical trader tends to react early and manage risk aggressively. Doing so on US Dollar Index on a one-hour chart with Ichimoku applied would have had you enter long on April 19, a few days after the breakout to ride one of the more aggressive FX moves of the year. That US Dollar Index continues to move higher by ~4% since the breakout on the 1-hour Ichimoku chart on April 19.
US Dollar Index (DXY) Trades To Highest Levels Since late-December, Broke Out on April 19
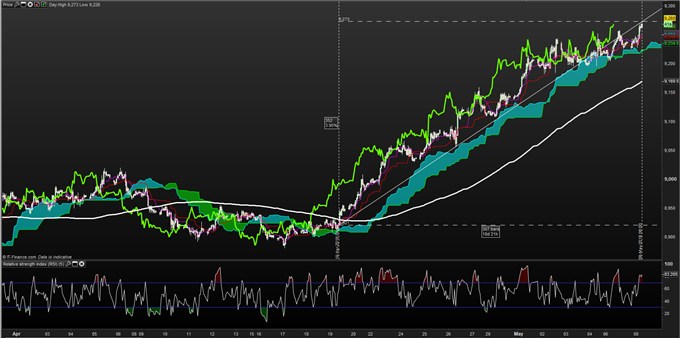
Chart Source: Pro Real Time with IG UK Price Feed. Created by Tyler Yell, CMT
Recommended Reading: US Dollar Index (DXY) Forecast: USD Strengthens As FX Foes Flop
JPY Strength A Prominent Theme
There are some themes that global macro investors cheer and others they’d rather not see. For those that have a bullish tilt to risk-seeking, JPY strength is a present theme that global risk buyers would rather not see.
The dashboard above shows Ichimoku on an hourly basis provides a clean bullish-JPY or bearish-JPY Cross basis. The chart below shows AUDJPY that aggressively down below the Ichimoku cloud and would favor re-entering on a bounce, should one develop with a focus on resistance at 8168/55.
Build confidence in your trading by checking out our popular guide here
JPY Strength Is On Clear Display Via AUD/JPY (60-minutes)
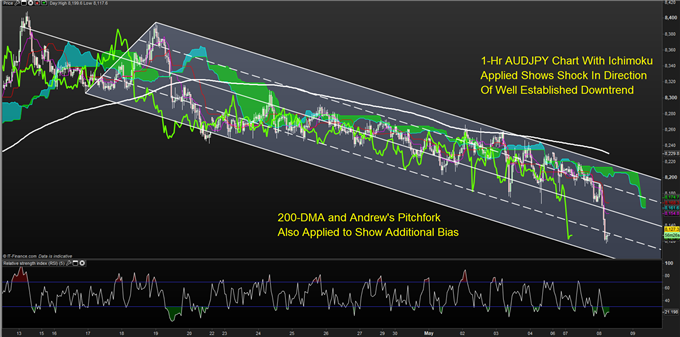
Chart Source: Pro Real Time with IG UK Price Feed. Created by Tyler Yell, CMT
Adding to Ichimoku with IG Client Sentiment
Ichimoku has value in helping traders see and trade in the direction of a momentum-backed trend. Retail traders, at least when looked through the lens of IG Client Sentiment, tend to fight strong trends.
We often recommend backing your technical analysis with IG client sentiment as it can do a good job of helping you see sentiment backed moves, which tend to carry on for long periods, which can make for good trades if you’re on the right side.
Insight from IG Client Positioning: Traders aggressively cut their short EUR/JPY trades suggesting the pair may drop further.
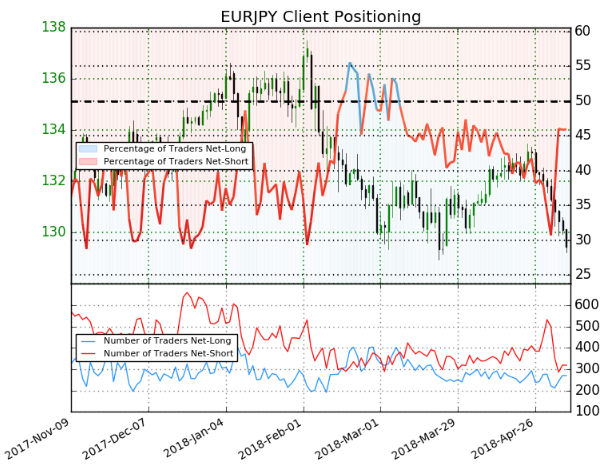
We typically take a contrarian view to crowd sentiment, and the fact traders are net-short suggests EURJPY prices may continue to rise. Yet traders are less net-short than yesterday and compared with last week. Recent changes in sentiment warn that the current EURJPY price trend may soon reverse lower despite the fact traders remain net-shorT (emphasis mine.)
New to FX trading? No worries, we created this guide just for you.
TO READ MORE:
Are you looking for longer-term analysis on the U.S. Dollar? Our DailyFX Forecasts for Q2 have a section for each major currency, and we also offer a excess of resources on USD-pairs such as EUR/USD, GBP/USD, USD/JPY, AUD/USD. Traders can also stay up with near-term positioning via our popular and free IG Client Sentiment Indicator.
Forex Trading Resources
DailyFX offers a surplus of helpful trading tools, indicators and resources to help traders. For those looking for trading ideas, our IG Client Sentiment shows the positioning of retail traders with actual live trades and positions.
Our trading guides bring our DailyFX Quarterly Forecasts and our Top Trading Opportunities; and our real-time news feed has intra-day interactions from the DailyFX team. And if you’re looking for real-time analysis, our DailyFX Webinars offer numerous sessions each week in which you can see how and why we’re looking at what we’re looking at.
If you’re looking for educational information, our New to FX guide is there to help new(er) traders while our Traits of Successful Traders research is built to help sharpen the skill set by focusing on risk and trade management.
---Written by Tyler Yell, CMT
Tyler Yell is a Chartered Market Technician. Tyler provides Technical analysis that is powered by fundamental factors on key markets as well as t1rading educational resources. Read more of Tyler’s Technical reports via his bio page.
Communicate with Tyler and have your shout below by posting in the comments area. Feel free to include yourmarket views as well.
Discuss this market with Tyler in the live webinar, FX Closing Bell, Weekdays Monday-Thursday at 3 pm ET.
Talk markets on twitter @ForexYell
Join Tyler’s distribution list.
Join Tyler’s distribution list.


