


What's inside:
- S&P 500 and Dow above eyed trend-lines, but closed yesterday unconvincingly
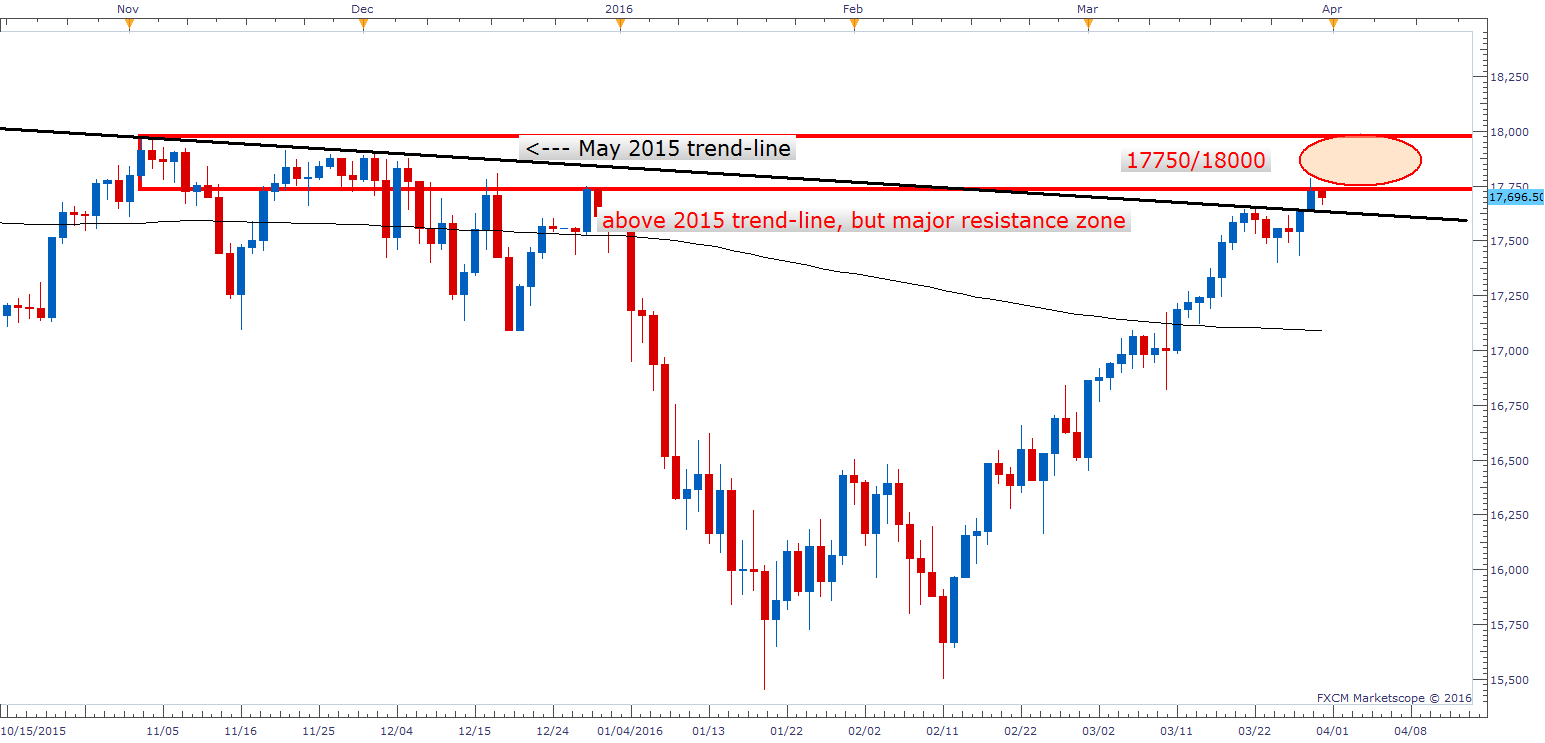
- Dow trades into major resistance zone between 17775 and 18000
- Reversal risk elevated, watching for signs of changing market behavior
Stocks continued to tack on gains yesterday post-Yellen, pushing the S&P 500 and Dow above trend-line resistance, but closed the US day session in unconvincing fashion. The end of the day weakness carried into overnight trade, pushing the S&P contract into support by way of the March 22 peak, where it is currently bouncing from. Short-term traders will want to take note of the area around 2055 as we move into the thick of trading today.
S&P 500 Daily/Hourly
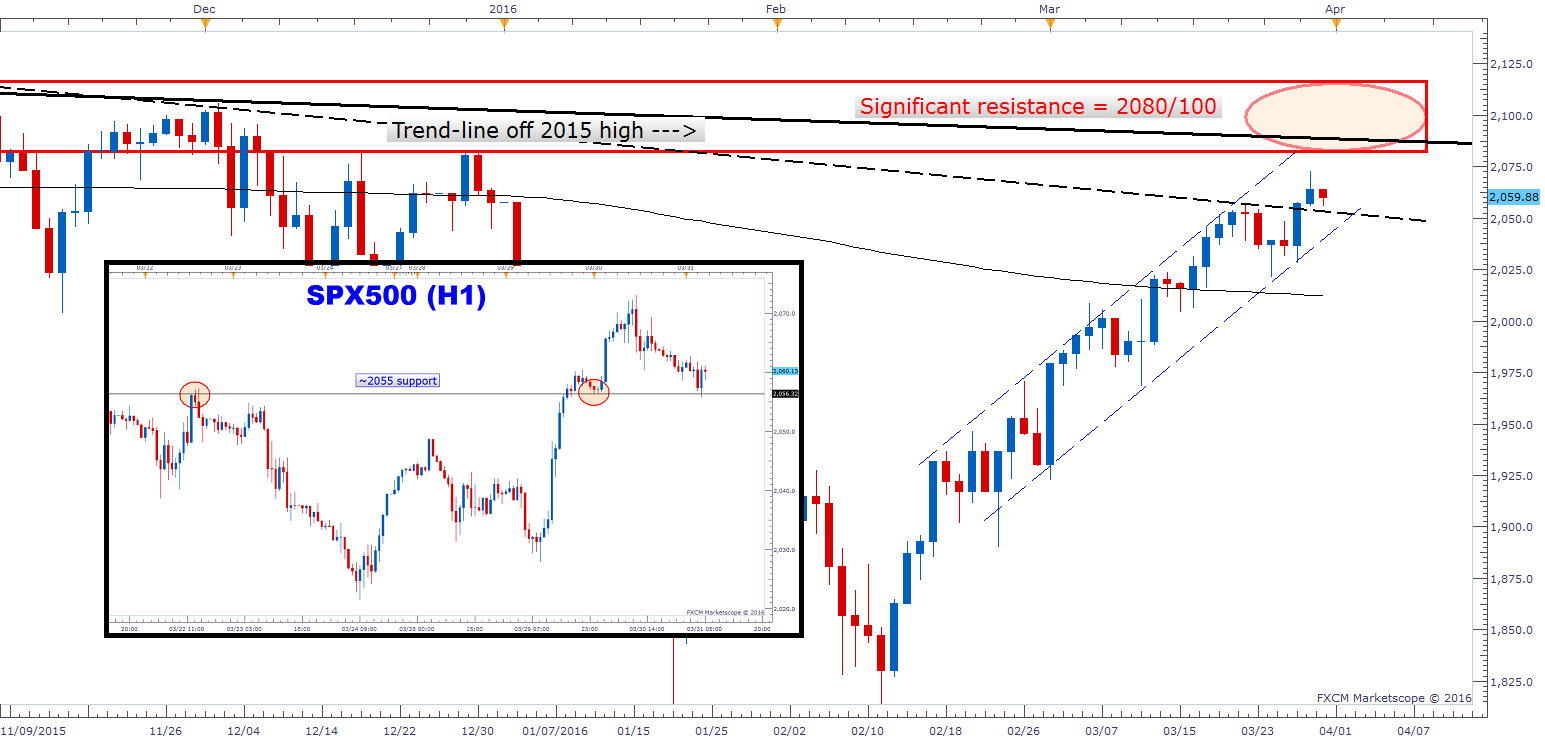
The Dow is trading at the lower-side of a significant resistance zone between 17775 to 18000, while the S&P 500 is shy of major resistance between 2080 and 2100. The Nasdaq 100 finally caught up to the 4450 to 4500 region which matches an area of resistance seen earlier in the month in the other two indices. The tech-heavy index struggled once it tried to top 4500 yesterday.
Dow Daily
Nasdaq 100 Daily

This makes for an interesting time to see market weakness set in. It's also a difficult time now for traders, with strong momentum and resistance colliding. Hard to buy, hard to sell. How the market reacts at these levels will be key for shaping our trading plan moving forward. The uptrend off the February 11 low has been strong in momentum and breadth, so we must continue to respect it until price action tells us otherwise. But at the same time, as stated yesterday, with an extended market running aground into resistance levels the risk of seeing a reversal has become elevated.
What we have seen on any decline since the February 11 low is buyers quickly step in within a couple of days. When this pattern is broken then we will take note in the change in behavior. A key change in behavior will be our signal that a meaningful decline, larger than any we have seen in recent weeks, is about to set in. Until then, despite elevevated risk into resistance the market can continue to drift higher, making for difficult trading conditions.
Check out this guide and see what profitable traders are doing to increase their earnings power.
---Written by Paul Robinson, Market Analyst
You can follow Paul on Twitter @PaulRobinsonFX, or email him directly at instructor@dailyfx.com.


