


- Haven Demand Returns as US-China Uncertainty Weighs, Pelosi Set to Land in Taiwan.
- European Semiconductor Stocks Fall.
What is Earnings Season & What to Look for in Earnings Reports
DAX 40: Retreats as Geopolitical Concerns Stir Haven Demand
The DAX retreated in European trade as weak global factory data fanned slowdown fears, while uncertainty reigns as U.S. House of Representatives Speaker Nancy Pelosi was set to visit Taiwan. These developments come as manufacturing PMI data from the United States, Europe and Asia, released over the last couple of days, showed a slowdown in factory activities in July, adding to recession fears.Moody's Investors Service flagged an increased risk of stagflation in European Union countries. Losses have however been limited as quarterly corporate earnings continue to provide support.

U.S. House of Representatives Speaker Nancy Pelosi was set to visit Taiwan on Tuesday, three sources said, as the United States said it wouldn't be intimidated by Chinese threats to never "sit idly by" if she made the trip to the self-ruled island claimed by Beijing. Such a move would raise tensions between the world’s two economic superpowers, with Chinese foreign ministry spokesman Zhao Lijian stating on Monday that it would lead to “very serious developments and consequences”. Fear around the potential visit is reflected in European semiconductor stocks, which fell between 0.6 and 3.6% in early trade. Most of the global chip production occurs in Asia, thus any escalation or increase in uncertainty regarding the geopolitics in the region could lead to chip shortages or steep price increases.
The other fear in this regard rests on the Taiwan Strait, which is the primary route for ships passing from China, Japan, South Korea and Taiwan to points west, carrying goods from Asian factory hubs to markets in Europe, the US and all points in between. Almost half of the global container fleet and a whopping 88% of the world’s largest ships by tonnage passed through the waterway this year, according to data compiled by Bloomberg. With supply and demand issues being felt globally this is the last thing markets need in order to regain some composure.
For all market-moving economic releases and events, see the DailyFX Calendar
DAX 40 Daily Chart – August 2, 2022
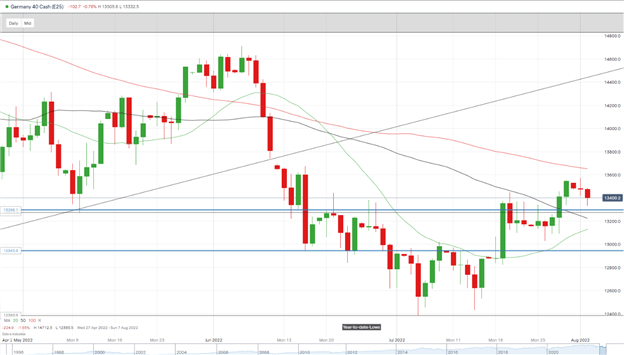
Source: IG
From a technical perspective, last week Friday saw a monthly candle close as a bullish candle of a level of support. We closed above the 50-SMA while at the same time maintaining a bullish structure (higher highs and higher lows) on the monthly timeframe. The daily timeframe saw a doji candlestick close yesterday as sentiment shifted in the US session. We currently trade between the 50 and 100-SMA with 13300 providing significant daily support. We maintain a bullish structure on the daily chart while only a break and candle close below the most recent lower high 13030 will result in a change of structure.
DAX 40 1H Chart – August 2, 2022
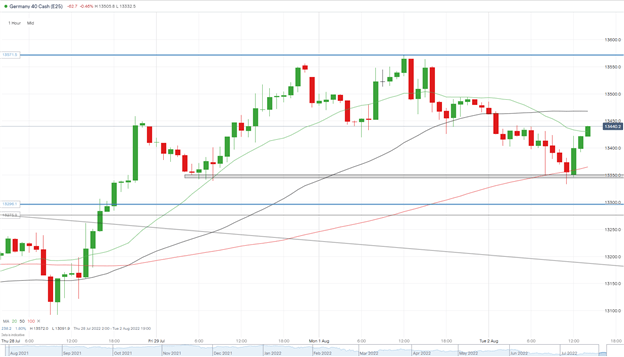
Source: IG
The 1H chart on the other hand saw the breakout of the trendline last week followed by a pullback before moving higher. Yesterday we created a new high of 13571 before a sharp pullback saw us surrender the day’s gains. We have just bounced off significant intraday support at 13350 which coincides with the 100-SMA. As choppy market conditions remain, the range between yesterday’s high and intraday support may provide an opportunity, while a break below support opens up the possibility of further retracement back towards the trendline.
Introduction to Technical Analysis
Technical Analysis Chart Patterns
Recommended by Zain Vawda
Key intraday levels that are worth watching:
Support Areas
•13350
•13275
•13150
Resistance Areas
•13571
•13750
•14000
| Change in | Longs | Shorts | OI |
| Daily | 5% | -10% | -6% |
| Weekly | -1% | 1% | 0% |
Written by: Zain Vawda, Market Writer for DailyFX.com
Contact and follow Zain on Twitter: @zvawda


