


- DAX 40:Lower as ZEW Economic Sentiment Disappoints.
- FTSE 100:Indecisive Despite Continued Decline in Retail Sales, PM Battle Heats Up.
- DOW JONES:Down as Earnings Season Comes into Focus.
DAX 40: Lower as ZEW Economic Sentiment Disappoints
The Dax remains pressured in a broad China-covid driven risk move alongside ongoing concerns around the Eurozone. Today’s ZEW economic sentiment index readings for the Eurozone and Germany were poor and missed already lowly expectations by a wide margin.
The Eurozone has been vulnerable to sharp gains in natural gas prices, and with the Nord Stream pipeline shutdown for servicing it is worthwhile considering the implications to gas and the DAX if Putin uses energy to blackmail Europe. Higher natural gas prices will impact both business and consumer decisions alike, ramping up costs and potentially delaying investment. This will have a significant knock-on effect on German growth, with the economy so heavily reliant upon manufacturing and physical goods.
Red dominates the sectoral breakdown with consumer cyclicals and non-cyclicals leading the way, both with losses of 1.76% respectively.
DAX 40 Daily Chart- July12, 2022
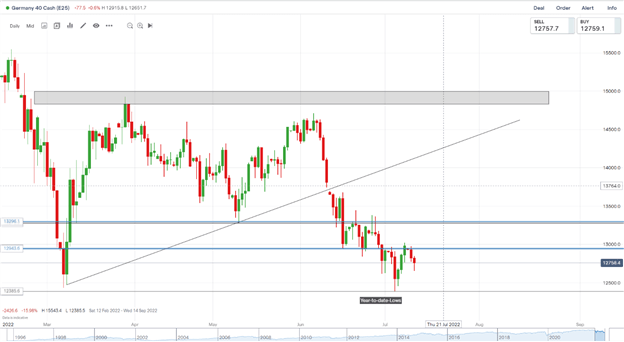
Source: IG
From a technical perspective, we continued to reject the psychological 13000 level yesterday and have continued pushing down today. Yesterday’s daily candle closed as a bearish engulfing candle of our psychological level which indicates potential for further downside. Price remains pressured as the fundamentals as well as technicals are not currently in favor of would-be longs.
Key intraday levels that are worth watching:
Support Areas
- 12700
- 12386
- 12000
Resistance Areas
- 13000
- 13300
- 13620
Trading Strategies and Risk Management
Volatility
Recommended by Zain Vawda
FTSE 100: Indecisive Despite Continued Decline in Retail Sales, PM Battle Heats Up
The FTSE opened lower in European trade and has swung between small gains and small losses during the morning session. Former Chancellor of the Exchequer, Rishi Sunak, has thrown his hat into the ring to become the next UK Prime Minister. Mr. Sunak, who is holding his campaign launch event on Tuesday, will insist he has a plan to deal with the economic "headwinds" the country is facing, saying it is a matter of "when" not "if" the tax burden starts to fall. He has pledged to cut taxes but only once inflation has been brought back under control.
On the economic front, UK retail sales have fallen for the third month in a row as households cut back on discretionary purchases amid the cost-of-living surge. June’s British Retail Consortium-KPMG tracker revealed sales volumes are falling at a rate not seen since the depths of the pandemic.
The blue-chip’s sectoral breakdown is mixed with utilities posting gains of 1.1% while basic materials lags in the red.
Introduction to Technical Analysis
Support and Resistance
Recommended by Zain Vawda
FTSE 100 Daily Chart - July 12, 2022
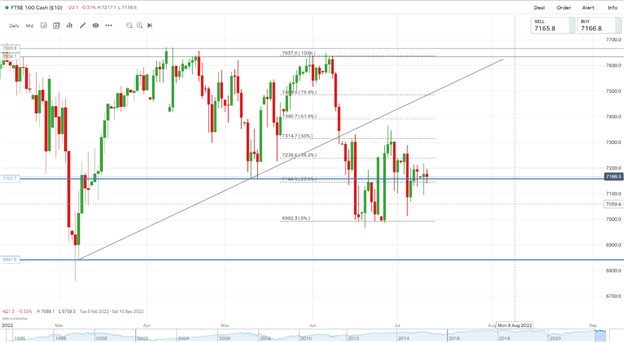
Source:IG
The FTSE closed last week as a hanging man candlestick signaling last week’s upside move may be short lived. Yesterday we recovered to close above our support area and the 23.6% fib level on the daily chart. As we pushed lower in European trade, the 23.6% fib level provided support. A break below could open up a test of support and an opportunity within the range. We have been ranging between the 0% and 50% fib level since the 10th of June which might be worth remembering if we do reach either of those levels.
Trading Ranges with Fibonacci Retracements
Key intraday levels that are worth watching:
Support Areas
- 7080
- 7012
- 6870
Resistance Areas
- 7240
- 7314
- 7400
| Change in | Longs | Shorts | OI |
| Daily | -30% | 25% | 2% |
| Weekly | -44% | 44% | 0% |
DOW JONES:Down as Earnings Season Comes into Focus
The Dow traded lower in premarket trade as we enter a potentially influential quarterly earnings season and with important inflation data looming large.The new earnings season starts in earnest later this week with the big banks due to report their second quarter results. Drinks giant PepsiCo started the ball rolling Tuesday, with the soft drinks giant raising its full-year revenue forecast, helped by sustained demand for its produce even in the face of rising prices.Companies have been lowering their expectations for the quarter with aggregate annual S&P earnings expected to grow 5.7% over the April to June period, according to data from Refinitiv as of Friday, down from the 6.8% forecast at the beginning of the quarter.
The economic calendar is noticeably quiet today, with US Federal Reserve member Thomas Barkin speaking at 16H30 GMT the only release of note.
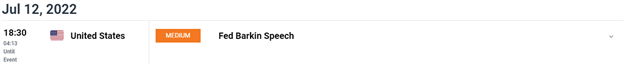
Customize and filter live economic data via our DailyFX economic calendar
DOW JONES Daily Chart – July 12, 2022
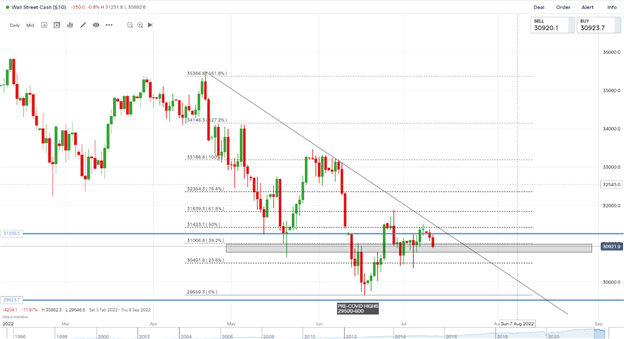
Source: IG
From a technical perspective, yesterday saw price push away from resistance provided by the 50% fib level while creating a new lower high. We have come close to a third touch of the trendline as well but have yet to do so. Given the ranging nature of indices recently any bounce higher could see us push into trendline resistance around the 31400 area before declining and potentially retesting the support area 30500.
Key intraday levels that are worth watching:
Support Areas
- 30500
- 30080
- 29600
Resistance Areas
- 31255
- 31450
- 31890
| Change in | Longs | Shorts | OI |
| Daily | -18% | 18% | 7% |
| Weekly | -19% | 14% | 4% |
Written by: Zain Vawda, Market Writer for DailyFX.com
Contact and follow Zain on Twitter: @zvawda


