


Trading Ranges with Fibonacci Retracements
Fibonacci analysis can be applied to financial markets in an attempt to discover potential future price action, and some may even consider it as a leading indicator. This article touches on range trading and explores how traders can utilize Fibonacci retracements when looking for potential areas of support and resistance that may appear in ranging markets.
Market Conditions: Range Trading
Markets basically have two conditions: Trend and Range. In between there’s a transitory state of ‘breakout’ that propels a range into a fresh trend.
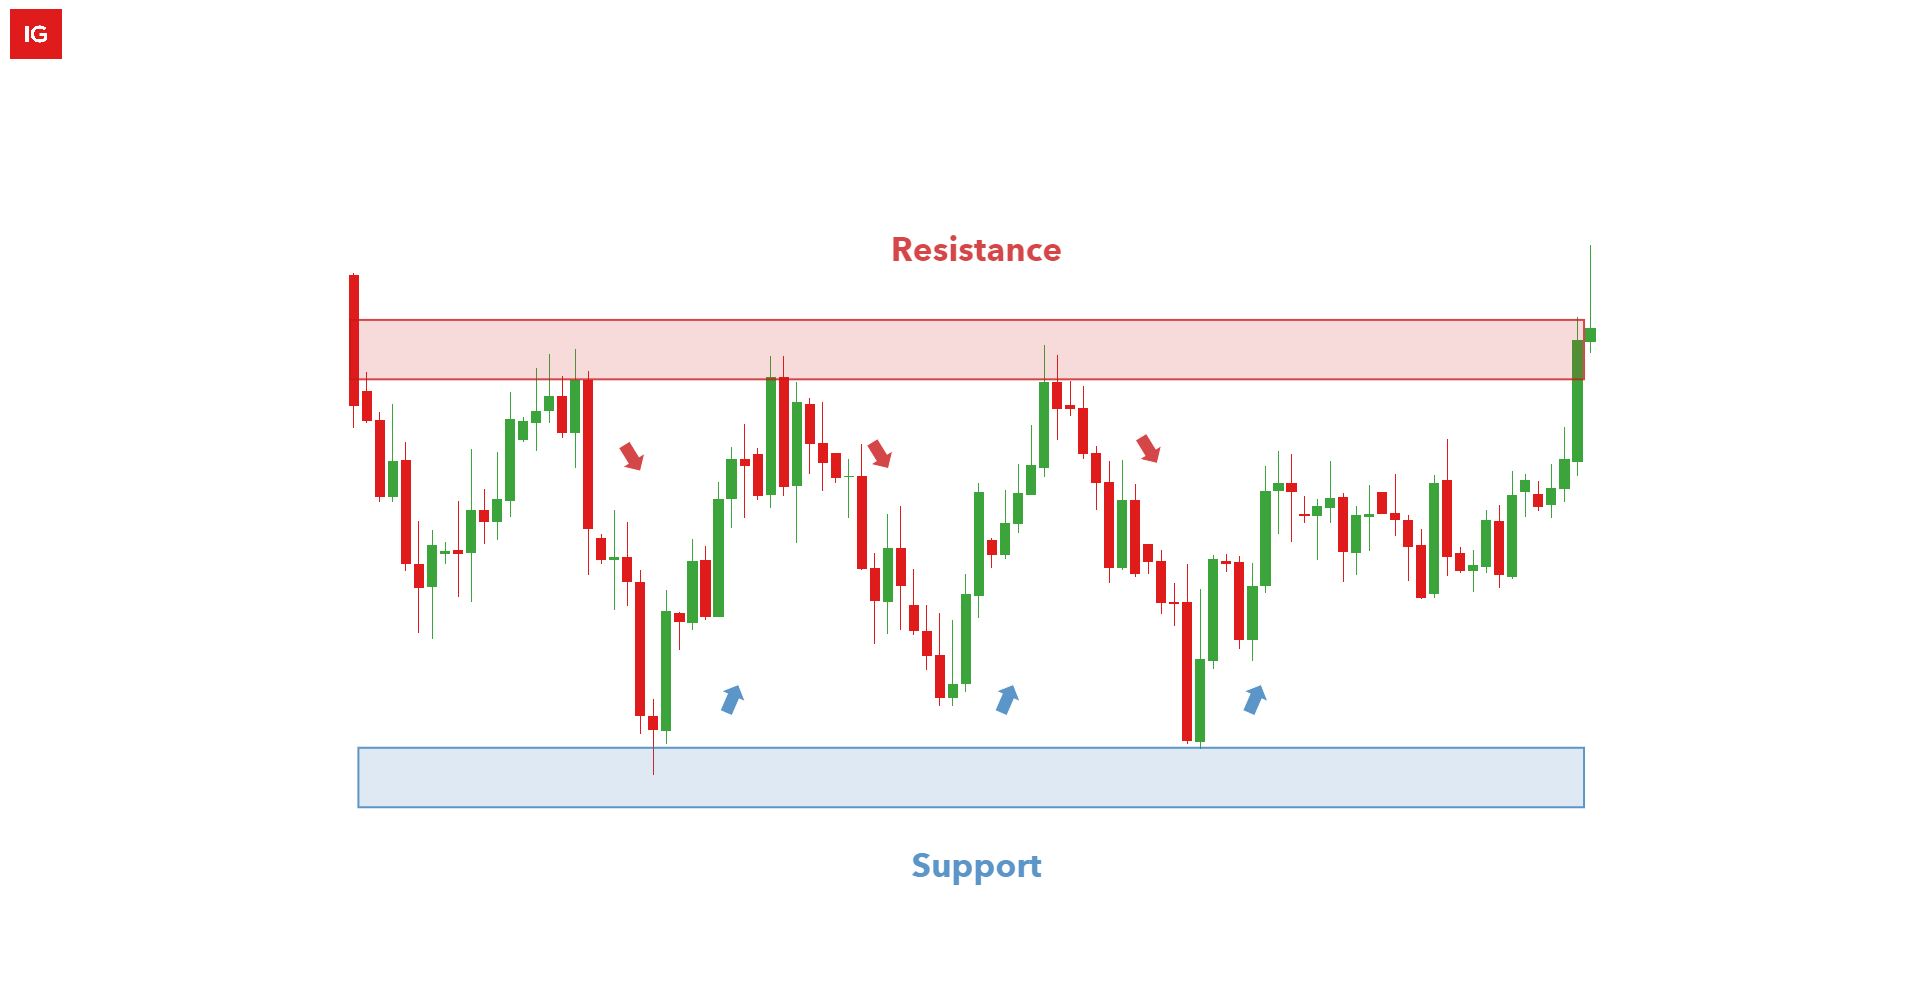
A ranging market environment develops when price trades between two well-established areas called support and resistance. Price tends to rise and often touches the area of resistance before failing to break higher and eventually turns lower. Likewise, price tends to drop toward support before failing to break lower and subsequently reverses higher. Witnessing successive instances of price action bouncing off support and resistance is crucial to establish a trading range.

Range Trading Illustration
At DailyFX, we have a dedicated support and resistance page showing areas of support and resistance for popular markets
For range traders, the possibility of a break above or below the range should never be discounted. Traders are encouraged to utilize the risk management tools available to them and adopt various risk management techniques.

Establishing Ranges with Fibonacci Retracements
When an asset advances or declines significantly, creating a major move, there is a tendency for the market to consolidate as it partially retraces or fully retraces the initial move. Fibonacci levels can provide clues around areas of potential support or resistance where such consolidation may take place.
Read our explanatory article on origin of Fibonacci
The daily GBP/USD chart below presents an area where price had a tendency to range between two Fibonacci levels. The major move produced in the month of March, 2020 presented a major move from which a Fibonacci retracement could be drawn; and for approximately four months after, price action showed multiple inflections off of these retracement levels while prices were mean reverting/ranging. Also added here is the 76.4% retracement level, which is a commonly included level to be used with Fibonacci retracements (1-.236 = .764).
Notice how support showed at both 38.2 and 50% retracement levels helped to exhibit support at various points through the range, which helped to hold the lows after prices pulled back.
GBP/USD Daily Price Chart (Feb 2020 – August 2020)
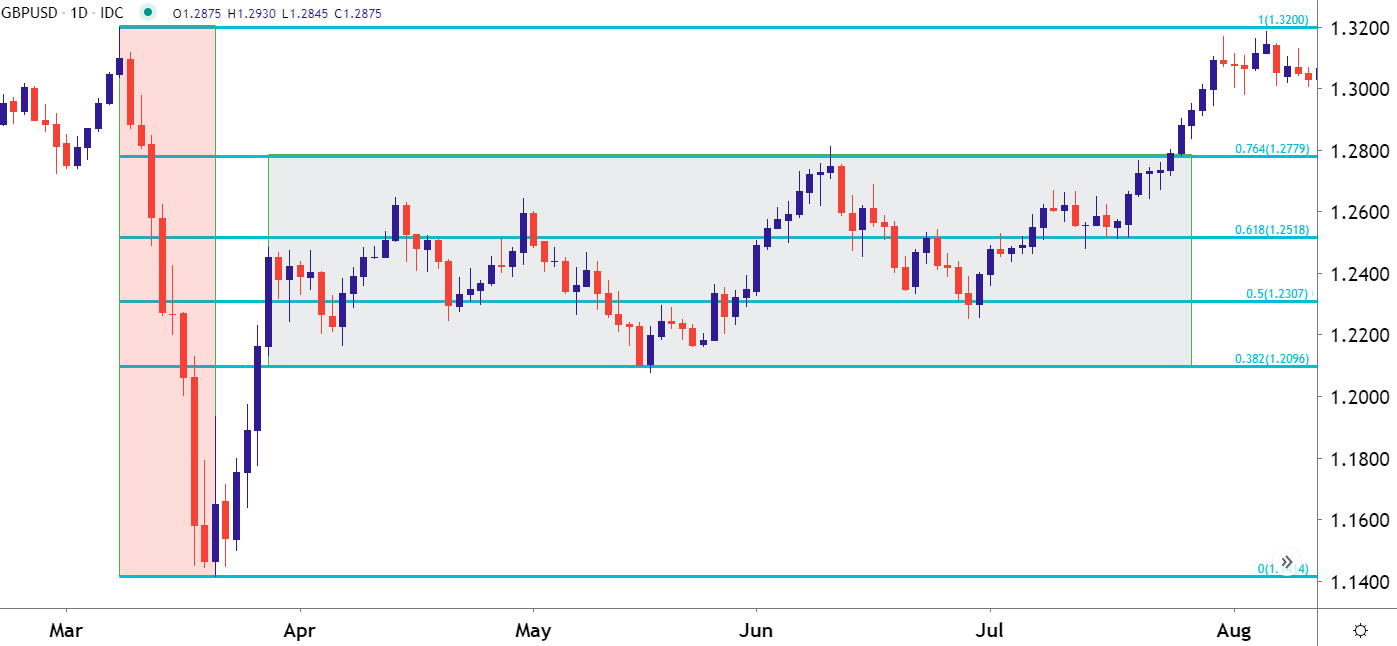
These Fibonacci levels correspond to the Fibonacci retracement drawn on the weekly chart from the 2017 high to the 2018 low, as shown below:
Trading Ranges with Fibonacci Retracements
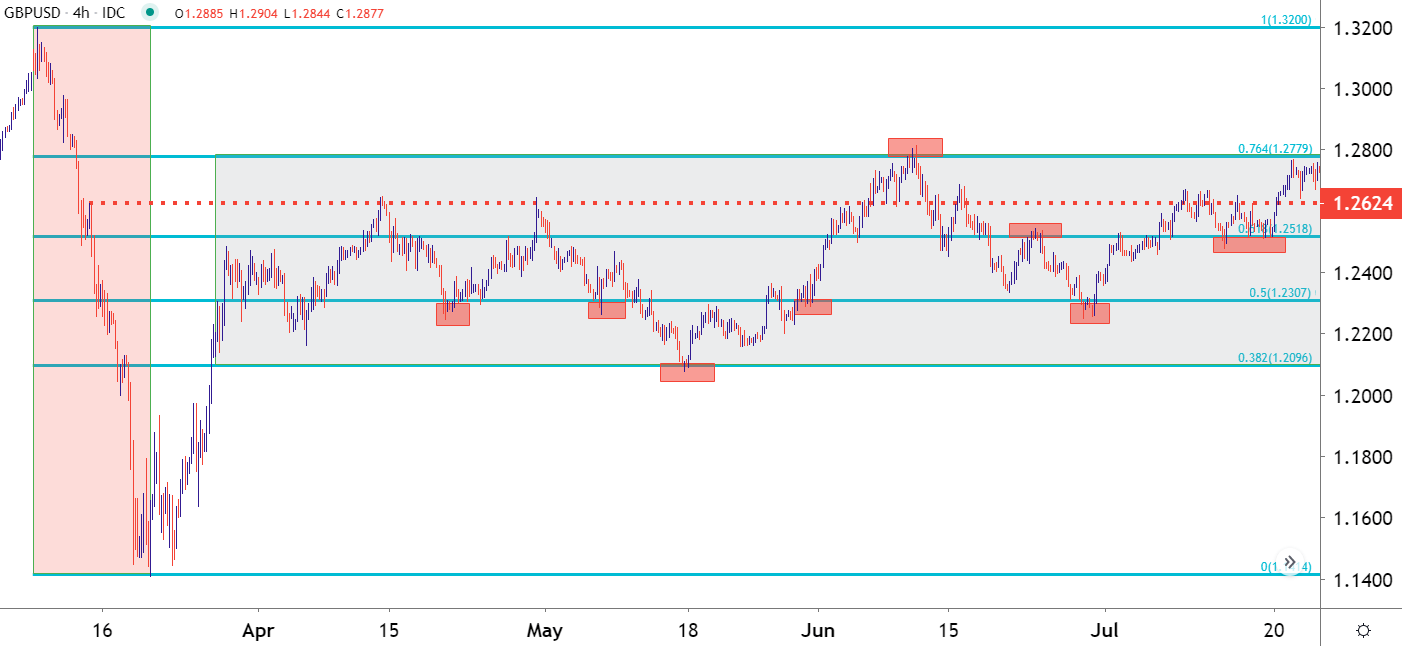
Returning to the same GBP/USD chart, from left to right, it is clear to see an extended period of lower highs and lower lows, presenting us with the initial downward trend. This was followed by a strong pullback that erased more than 50% of that prior major move, after which price action moved into a range (shown in grey below).
Incorporating prior swing high resistance around 1.2641 helped to further define that range, and notice how there were multiple inflections at these retracement levels during the four-month-range that later developed. Towards the right side of the chart, you’ll see an eventually build of support around the 61.8% retracements; highlighting a higher-low that eventually led to a topside breakout in GBP/USD.
GBP/USD Four-Hour Chart (March 2020 – July 2020)
When in a mean reversion/range environment, the trader’s goal is often to concentrate risk outlay by relying on the possibility of range continuation. As in, if the range is going to break, the trader would likely want to investigate loss mitigation given that the condition they were looking to work with no longer applies.
This can allow for relatively tight stop placement, particularly if support is defined by a Fibonacci retracement level. This can allow the trader to focus on risk minimization when plotting for range continuation; whether that support is coming from a 38.2, 50 or 61.8% retracement levels.