


Gold Price (XAU/USD), Chart, and Analysis
- Gold stuck in a very narrow range.
- Market conditions are set up for a breakout, will the Fed oblige?
How to Manage the Emotions of Trading
Gold remains stuck on either side of $1,785/oz. with volatility sitting at a multi-month low as traders wait for the latest Federal Reserve rate decision and economic projections to be released on Wednesday. The precious metals trading range continues to narrow and this may lead to a sharp breakout, one way or another, depending on the meeting’s outcome. Last week’s US inflation report did little to move the dial despite inflation hitting a near 40-year high, while the yield on the interest-rate sensitive US 2-year has drifted lower post-release, easing downward pressure on the precious metal. The longer gold remains rangebound, the higher the probability of sharp breakout.
US Dollar (DXY) Remains Supported Ahead of Significant FOMC Meeting
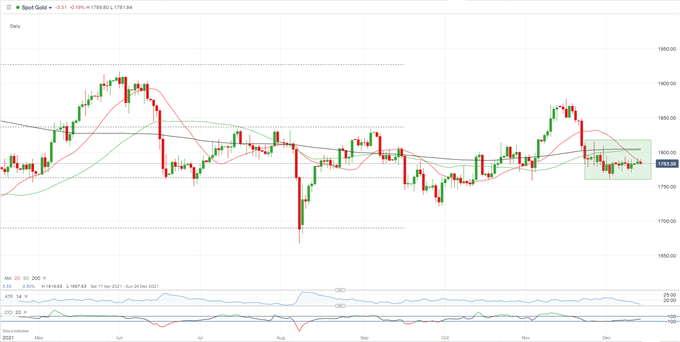
The gold chart shows gold boxed in with the daily price range narrowing over the last few days. The Average True Range (ATR) indicator at the bottom of the chart is at a multi-month low around $16/oz. highlighting the current tepid trading conditions. Initial support comes off the 50% Fibonacci Retracement level at $1,763/oz. while $1,809/oz, and $1,815/oz. provide short-term resistance. Last week the 20-day sma moved below the 50- and 200-day smas, giving the chart a negative bias, while IG client positioning shows retail traders remain heavily long of gold, normally a negative contrarian indicator. A breakout is likely soon and it will be initiated by Wednesday’s FOMC decision and updated outlook.

Gold (XAU/USD) Daily Price December 14, 2021
Retail trader data show79.14% of traders are net-long with the ratio of traders long to short at 3.79 to 1. The number of traders net-long is 0.62% lower than yesterday and 2.39% lower from last week, while the number of traders net-short is 10.64% higher than yesterday and 0.63% lower from last week.
We typically take a contrarian view to crowd sentiment, and the fact traders are net-long suggests Gold prices may continue to fall.Yet traders are less net-long than yesterday and compared with last week. Recent changes in sentiment warn that the current Gold price trend may soon reverse higher despite the fact traders remain net-long.

What is your view on Gold – bullish or bearish?? You can let us know via the form at the end of this piece or you can contact the author via Twitter @nickcawley1.


