


S&P 500, Dow Jones, ASX 200, Omicron, PBOC Easing, RBA – Asia Pacific Indices Briefing
- S&P 500, Dow Jones, Nasdaq 100 rise in uneven recovery as cyclical shares shine
- Omicron Covid-19 variant woes fade as PBOC deploys easing to boost economy
- ASX 200 may rise if RBA continues to undermine 2022 hawkish policy estimates

Monday’s Wall Street Trading Session Recap
Market sentiment recovered on Monday following a volatile week on Wall Street. Futures tracking the S&P 500, Dow Jones and Nasdaq 100 closed +1.16%, +1.87% and +0.80% respectively. This is as the VIX Index, often referred to as the market’s preferred ‘fear gauge’, declined 11.32%. Broadly speaking, investors seemed to rotate back into value stocks as growth equities relatively underperformed.
A couple of factors may have played a role in this dynamic. First, initial reports from South Africa about the emerging Omicron Covid-19 variant showed that hospitals have not been overwhelmed at this moment in time. President Joe Biden’s Chief Medical Advisor, Anthony Fauci, noted that the data from the country was ‘a bit encouraging regarding severity’.
This likely bodes well for global growth estimates, boosting cyclically sensitive industries. Travel stocks generally performed well, including airlines, hotels and cruise ship companies. Also, December 2022 Fed rate hike bets continued to recover from the weakening triggered by the Omicron variant last month. China’s central bank cut bank reserve ratios by 50 basis points, signaling support to a weakening economy.
S&P 500 Technical Analysis
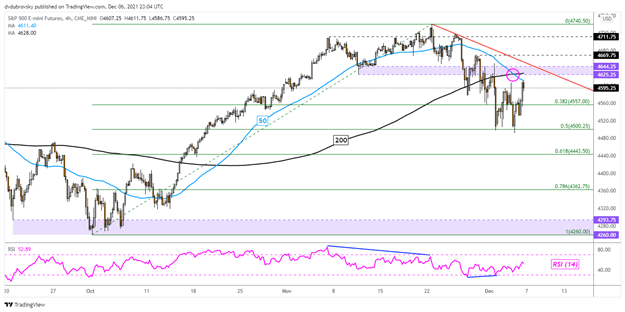
S&P 500 futures face the next key resistance zone as the index attempts to recover from losses over the past couple of weeks. A bearish ‘Death Cross’ emerged between the 50- and 200-period SMAs on the 4-hour chart, offering a downside technical bias. This is also just under the 4625 – 4644 inflection zone. A turn back lower may place the focus on the midpoint of the Fibonacci retracement at 4500. Resuming the near-term downtrend entails a break under this floor.
Introduction to Technical Analysis
Candlestick Patterns
Recommended by Daniel Dubrovsky
S&P 500 4-Hour Chart
Tuesday’s Asia Pacific Trading Session
The rosy setting on Wall Street could precede a similarly upbeat session during Tuesday’s Asia-Pacific trading hours. Australia’s benchmark stock index, the ASX 200, is in particular focus. China is Australia’s largest trading partner, and measures from the PBOC to stimulate the economy could reverberate outward and offer a boost to the latter’s GDP.
The Reserve Bank of Australia is also on tap, where the central bank is expected to leave benchmark lending rates unchanged at 0.10%. Traders continue to price in RBA rate hikes in 2022, but this seems to be differing from the central bank’s outlook. Tempering those expectations could offer further support to the ASX 200.
Trading Strategies and Risk Management
Global Macro
Recommended by Daniel Dubrovsky
ASX 200 Technical Analysis
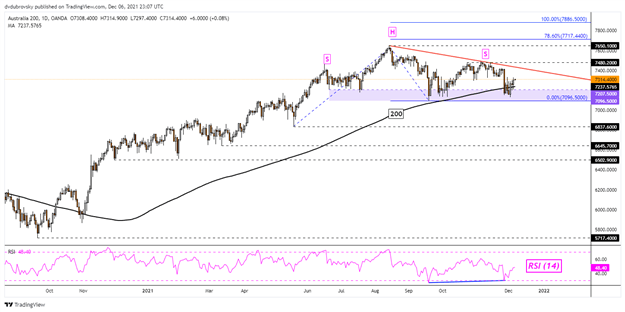
On the daily chart, the ASX 200 still appears to be carving out a bearish Head and Shoulders chart formation. However, the recent cautious turn higher on the neckline – which seems to be around 7096 – 7207 – may undermine the chart formation. Moreover, the 200-day SMA is holding up as support, maintaining the broader upside focus. Further gains may place the focus on the right shoulder, where resistance seems to be at 7480. Otherwise, a breakout lower exposes lows from April.
ASX 200 – Daily Chart
--- Written by Daniel Dubrovsky, Strategist for DailyFX.com
To contact Daniel, use the comments section below or @ddubrovskyFX on Twitter
Trade Smarter - Sign up for the DailyFX Newsletter
Receive timely and compelling market commentary from the DailyFX team


