


S&P 500, Nasdaq 100, Dow Jones, ASX 200, Omicron Variant, Powell – Asia Pacific Indices Briefing
- S&P 500, Nasdaq 100, and Dow Jones sink as Omicron variant emerges in the US
- Follow-through may depend on if governments impose lockdowns, eyes on Asia
- ASX 200 showing a Head and Shoulders chart formation, support remains in play

Wednesday’s Wall Street Trading Session Recap
Stocks on Wall Street sold off aggressively on Wednesday, pressuring the S&P 500, Nasdaq 100 and Dow Jones. S&P 500 futures suffered a 3.06% loss over the past 2 trading sessions, the worst 2-day loss since October 2020. Investors fled to the safety of Treasuries, pushing up longer-term rates at the cost of yields. The VIX market ‘fear gauge’ closed at its highest since early February.
The selloff on Wall Street could be attributed to two key components. The first has been the relatively hawkish pivot from the Federal Reserve. Today, Chair Jerome Powell reiterated that it could be appropriate to consider faster tapering. This follows the central bank’s pivot on inflation, where earlier this week, Mr. Powell retired the word ‘transitory’ in explaining countrywide average price growth.
The second component was the first discovery of the emerging Omicron Covid-19 variant in the United States. This could risk undermining the gradual global reopening. Understandably, some of the worst-performing stocks could be found in travel industries. The Russell 2000 Index, which is composed of small-cap equities, closed at its lowest since August after slumping 2.34%.
S&P 500 Technical Analysis
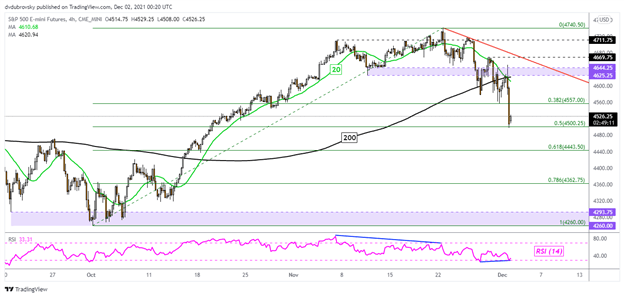
Taking a look at the 4-hour chart of S&P 500 futures, we can see that the recent drop paused right on the midpoint of the Fibonacci retracement at 4500. This also follows positive RSI divergence, showing that downside momentum is fading. But, the index has confirmed a breakout under the 200-period Simple Moving Average (SMA). That could spell broader weakness, placing the focus on October lows. In the event of a turn higher, keep a close eye on the 20-period SMA. The latter could maintain the downtrend.
Introduction to Technical Analysis
Candlestick Patterns
Recommended by Daniel Dubrovsky
S&P 500 4-Hour Chart
Thursday’s Asia Pacific Trading Session
Futures tracking Wall Street have slightly recovered heading into Thursday’s Asia-Pacific trading session. This may trim some of the anticipated downside gaps across APAC benchmark stock indices. The regional economic docket is light, placing stock markets under the mercy of risk appetite. As more information crosses the wires about the Omicron variant, keep a close eye on how governments chose to respond.
An absence of strict lockdowns could keep market mood intact. Australia’s Chief Medical Officer, Paul Kelly, noted that there is ‘no indication’ that the new variant could be more deadly than other strains. The nation has reported 7 cases of Omicron, with 6 of those in New South Wales. A lack of immediate lockdowns could keep the ASX 200 from extending losses. Still, the situation remains fluid.
Trading Strategies and Risk Management
Global Macro
Recommended by Daniel Dubrovsky
ASX 200 Technical Analysis
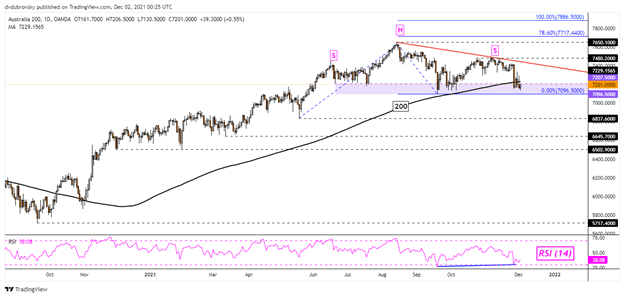
The ASX 200 could be forming a bearish Head and Shoulders chart formation. A right shoulder seems to have been confirmed with resistance around 7480. Now, the index is facing the neckline of the H&S, making for a zone of support between 7096 and 7207. The 200-day SMA is also in focus, which may maintain the broader uptrend. Positive RSI divergence is also present here. Clearing support exposes the May low at 6837.
ASX 200 – Daily Chart
--- Written by Daniel Dubrovsky, Strategist for DailyFX.com
To contact Daniel, use the comments section below or @ddubrovskyFX on Twitter
Trade Smarter - Sign up for the DailyFX Newsletter
Receive timely and compelling market commentary from the DailyFX team


