


FINTWIT ANALYSIS
- OPEC monthly report largely unchanged, bullish technical setup.
- SPX earnings season slowdown, Fed taper and monthly seasonality.
- GBP at critical juncture both fundamentally and technically.
OPEC HOLDING BACK SUPPLY MAY SUSTAIN HIGH BRENT CRUDE PRICES
OPEC released its monthly oil market report for November this week which did not contain any major revisions from the previous report, resulting in minimal brent crude price action. Key highlights pf the report include:
- 2021 global demand revised lower by +/-0.2 mb/d.
- 2022 global oil demand growth remains unchanged at 4.2mb/d.
- According to OPEC, expected growth in non-OPEC supply allows for them to maintain its current gradual unwinding of supply (helps maintain current prices).
BALANCE OF SUPPLY AND DEMAND
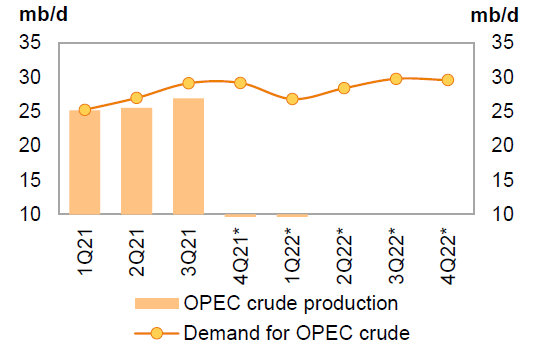
Source: OPEC
The chart above shows the supply and demand imbalances thus far in 2021. The trend of excess demand is likely to continue as we round off 2021 however, the margins are likely to reduce as supply increases and demand is anticipated to drop. Expected drops in demand from both China and India due to high prices may weigh negatively on brent crude going froward.
BRENT CRUDE (LCOc1) DAILY CHART

Chart prepared by Warren Venketas, IG
The daily brent crude chart above may be suggestive of a bull flag pattern (blue), traditionally representing a continuation of the earlier uptrend. Last week saw an unsuccessful test of the $80.00 support level which simultaneously broke below flag support. The daily candles did not close below flag support thus leaving behind two long lower wicks (bullish indication). A confirmation close below flag support may suggest further downside and potentially targeting subsequent support levels.
From the bullish perspective, a break above flag resistance could bring the $86.65 resistance level into consideration.

Key resistance levels:
- $86.65
Key support levels:
- $80.00
- 100-day EMA (yellow)
S&P 500 INDEX SLIPS AFTER ALL-TIME HIGHS
Earnings season in the U.S. has given SPX bulls the much needed stimulus to hit record levels last week but has since dissipated as Fed taper talk and the potential for sooner than expected tightening in 2022. This does not bode well for the SPX constituents long-term as the current accommodative environment may soften ahead of time.
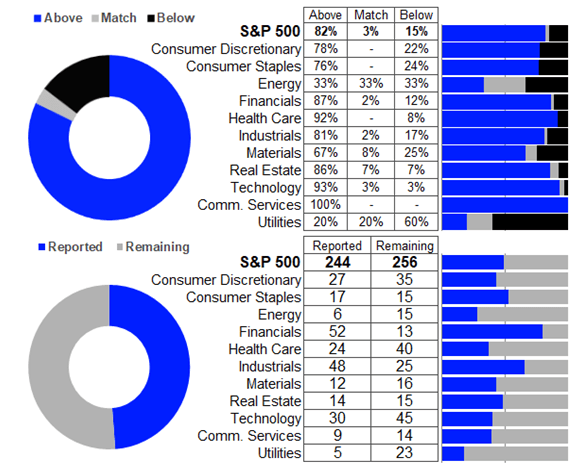
Thus far we have witnessed a remarkable feat of 82% of earnings coming in above estimates according to Refinitiv – see graphic below. With more to come, the index may see consequent highs should this trend continue; a likely outcome as prior results have revealed the ability of U.S. firms to transfer the cost of inflation onto the end consumer.
Boost your stock market knowledge with our articles on the types of stocks available, how equities impact the economy, and getting started with stock trading.
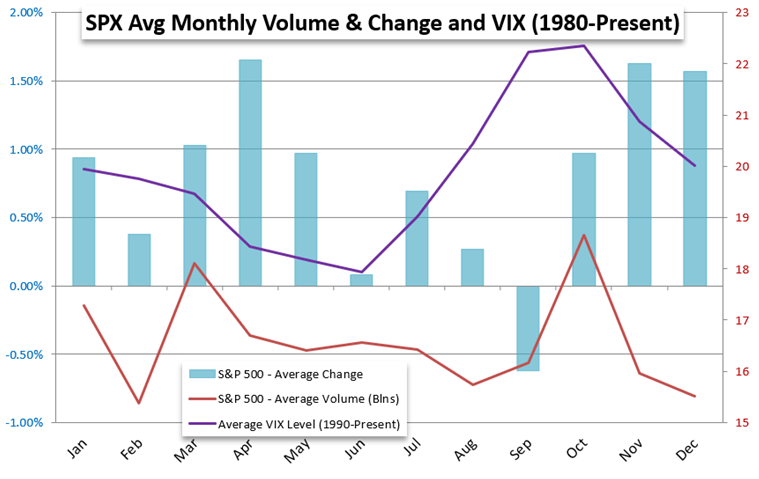
The bullish argument is further augmented by historic trends as seen in the chart below. November tends to provide significant gains compared to other months of the year barring April along with lower volatility. The volatility aspect holds true in 2021 and only time will tell if the SPX will live up to its reputation of outperformance in November.
SPX DAILY CHART
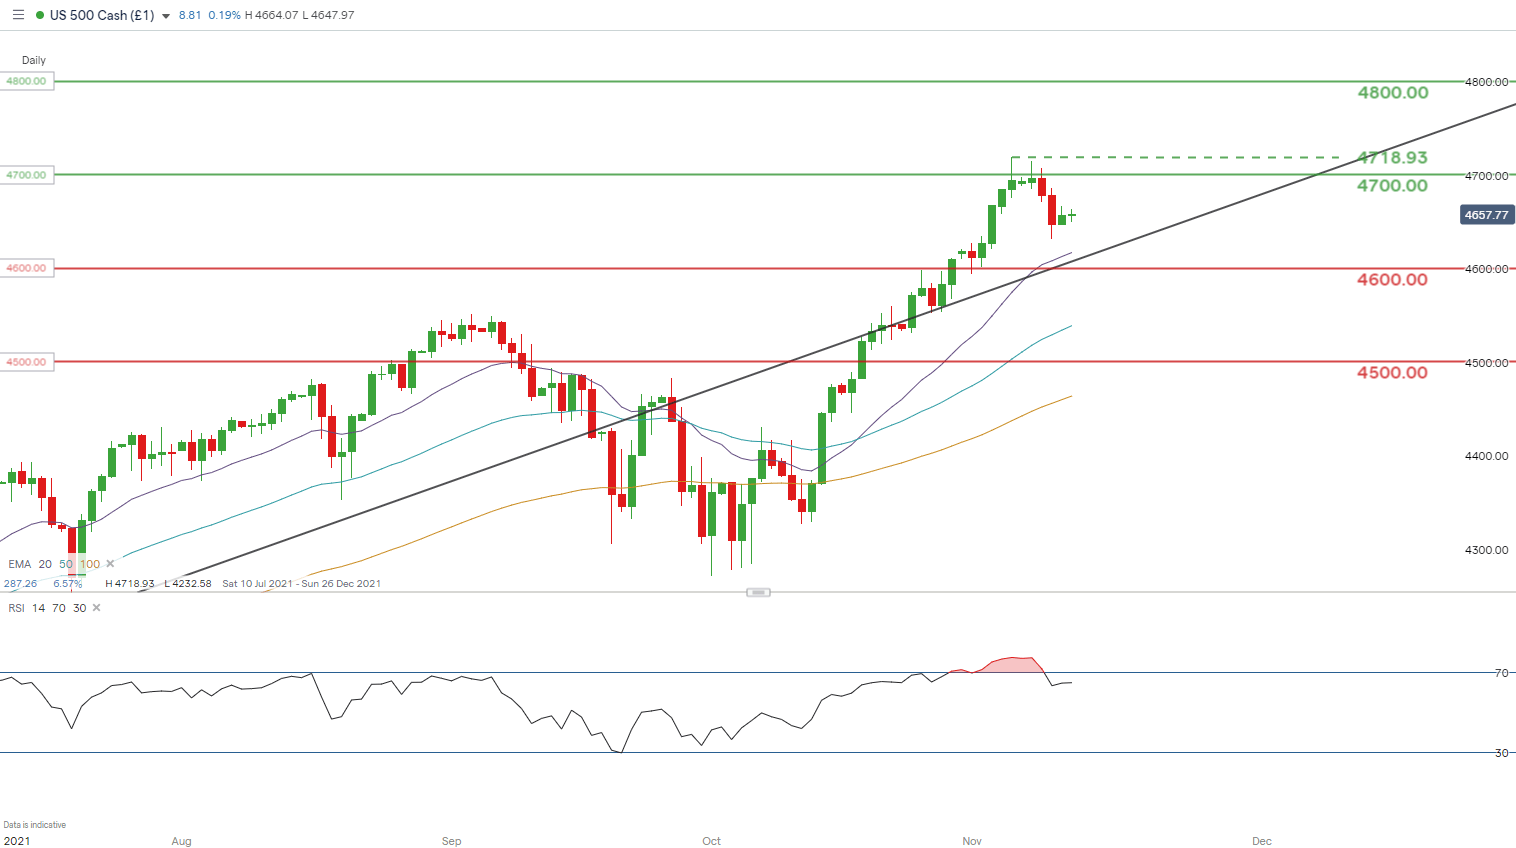
Chart prepared by Warren Venketas, IG
Recent wading in and around the longer-term trendline (black) may continue as earnings season develops. Month-to-date (MTD) the index is already up 0.95%, still below the historic average of +1.50% albeit a rough guideline. This being said, SPX has been quite extended to the upside and has recently come out of overbought territory on the RSI so the current drop in price may push lower towards trendline support.

Key resistance levels:
- 4800.00
- 4718.93
- 4700.00
Key support levels:
- Trendline support
- 4600.00
UK ECONOMIC DATA MAY KICKSTART HAWKISH PRESSURE NEXT WEEK
Pound sterling has been in free fall since the Bank of England (BoE) surprise rate announcement last week. The U.S. dollar has concurrently gained traction as a safe-haven play (Evergrande) and an increase in the policy tightening debate. Thursday this week saw weak UK GDP data adding to the depreciation against the greenback. Next week, UK inflation may spark a recovery for the pound should actual data come in higher than expected – see calendar below.


Source: DailyFX economic calendar
The December BoE meeting as outlined below has markets pricing in a 51.65% probability of a rate hike at 0.35%. I foresee this percentage probability figure to escalate as the meeting draws closer in December. The reasoning behind this the persistent inflation rhetoric being sustained with global supply constraints and elevated energy prices unlikely to abate during this period. This should lead to a stronger GBP, but the dollar faces similar motivating factors that favor USD strength. The difference between the Fed and BoE in terms of rate hike paths (timeline) may sway courtesy to sterling short-term as the Fed is likely to only hike in 2022 (potentially 2023) while the BoE could announce a hike in the December meeting.
BoE RATE HIKEPROBABILITY
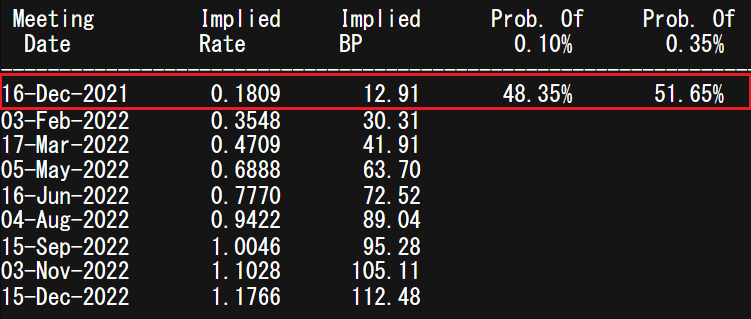
Source: Refinitiv
Article 16 as detailed in the write-up by my colleague Justin McQueen has brought an additional negative haze around the pound. The potential for a trade war between the EU and UK could be catastrophic for the currency and progress on this matter should be monitored closely.
GBP/USD DAILY CHART

Chart prepared by Warren Venketas, IG
For much of 2021 GBP/USD has been trading within a downward channel (black) as shown in the daily chart above. Channel support is being called into question once more. Can this lower trendline hold? We have seen marginal breaks below trendline support in March 2021 but has since held firm against bearish pressure. The fundamental economic data should give some directional bias to the pair next week which I believe should see some uptick in GBP/USD price action.
The Relative Strength Index (RSI) supports this notion in the form of bullish divergence which related to a contrary movement in the RSI (green) relative to the underlying price action. In simple terms, GBP/USD is forming lower lows while the RSI reflects higher lows (green). Generally this phenomena leads to higher prices of the underlying asset but timeframe can be difficult to predict.
In summary, there is potential for further downside (short-term) but I believe this will be limited before the a reversal in price leads to pound appreciation.

Key resistance levels:
- 1.3800
- 1.3579 – 23.6% Fibonacci
- 1.3412 – September swing low
Key support levels:
- 1.3300
- 1.3164 – 38.2% Fibonacci
Contact and follow Warren on Twitter: @WVenketas


