


Relative Strength Index – Talking Points:
- What is Relative Strength Index (RSI)?
- How do you calculate Relative Strength Index?
- What does the Relative Strength Index tell you?
- Relative Strength Index: A Summary
- Become a Better Trader with Our Trading Tips

What is Relative Strength Index (RSI)?
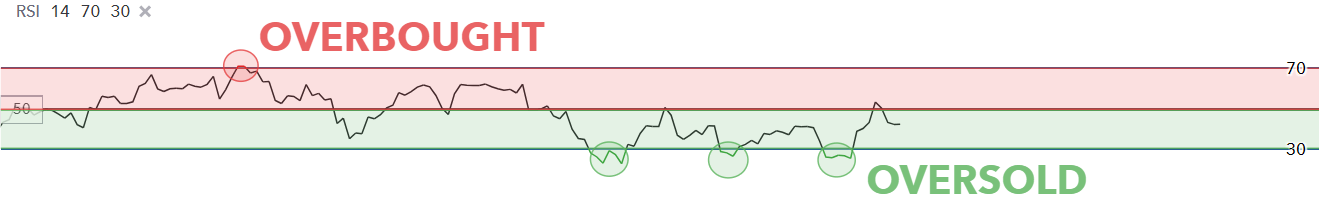
The Relative Strength Index (RSI) is a technical analysis tool that is used to measure the degree of recent price movement of an asset/market to determine overbought or oversold conditions. The RSI is referred to as a momentum oscillator which fluctuates between 0 and 100.
Notice the ‘mid-line’ at 50 in the image below - traders will frequently use this as a cut-off. If the RSI is reading above 50, traders will consider the trend to be bullish. If RSI is below 50, traders will often consider the momentum to be bearish. Traders have also taken this a step further, with the idea that if RSI goes over 70 – the pair is not only bullish, but potentially overbought. Alternatively, traders often assume that if RSI is below 30 – the pair isn’t just bearish, it may be oversold.
How do you calculate Relative Strength Index?
Relative Strength Index (RSI) is calculated by:
RSI was developed by engineer, mathematician, and trader J. Welles Wilder. Wilder was a stock and commodities trader at the time and he encountered a common problem regarding timing of trade entry and exit points. Wilder then developed a formula to overcome this challenge and allow traders to better time long and short entry/exit points.
RSI will grade the price movement exhibited between candles for the last ‘X’ periods (with ‘X’ being the input used by the trader, commonly 14 with RSI). As price changes, RSI will register these changes in price – relative to previous price movements to show market ‘strength.’
What does the Relative Strength Index tell you?
There are several ways to use the RSI in trading, which will be outlined in the examples below:
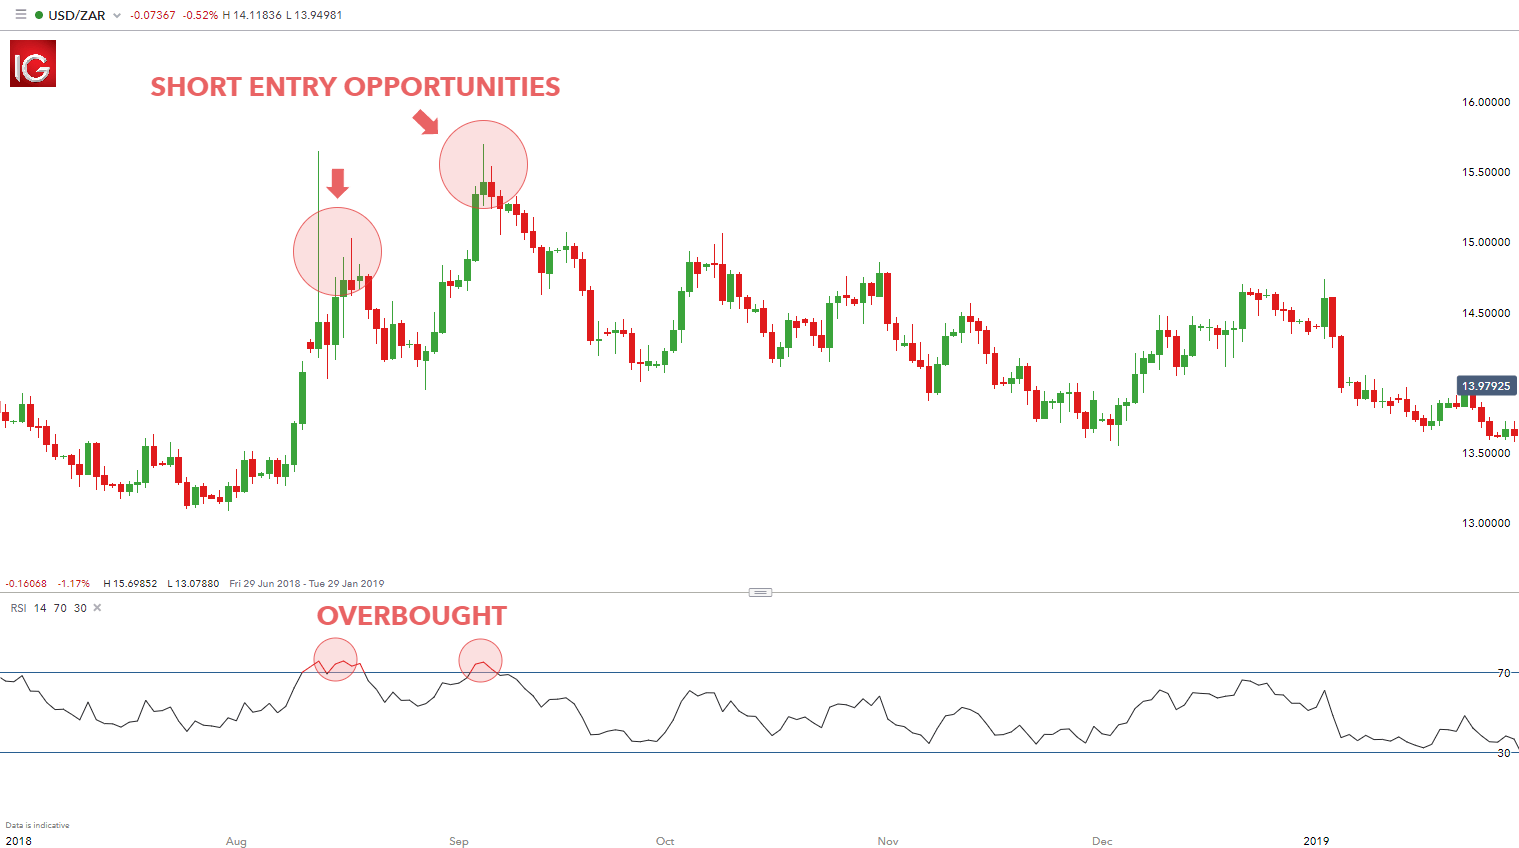
The first two images below represent the most basic method of using the RSI by interpreting overbought and oversold junctures whereby potential trade entry points occur.
1. Overbought signal USD/ZAR - The USD/ZAR chart shows an overbought RSI signal above the ‘70’ level indicating potential short entry opportunities.
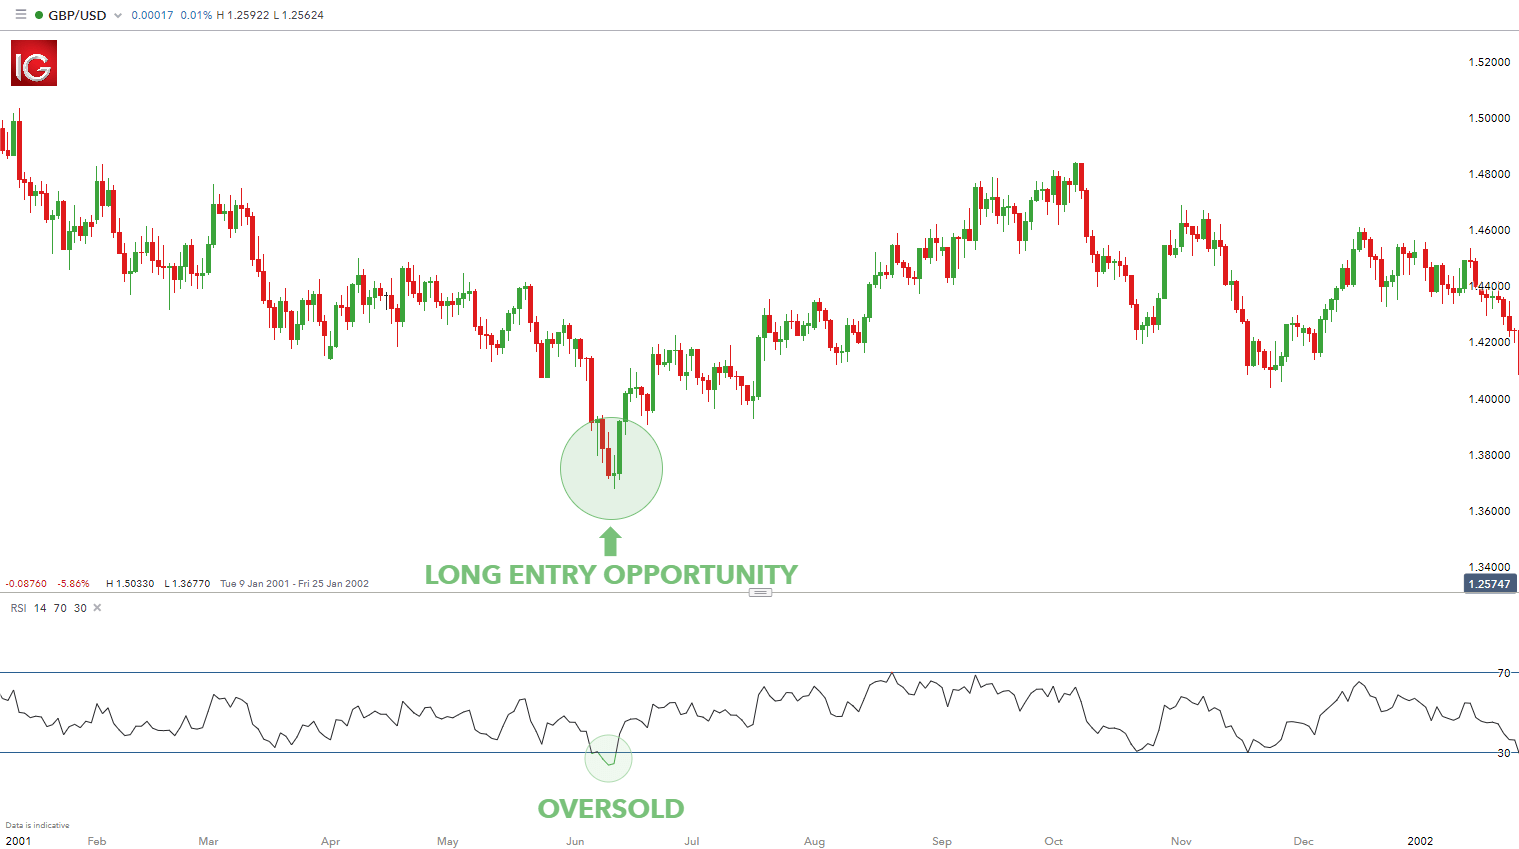
2. Oversold signal GBP/USD - The GBP/USD chart shows an oversold RSI signal below the ‘30’ level indicating potential long entry opportunities.
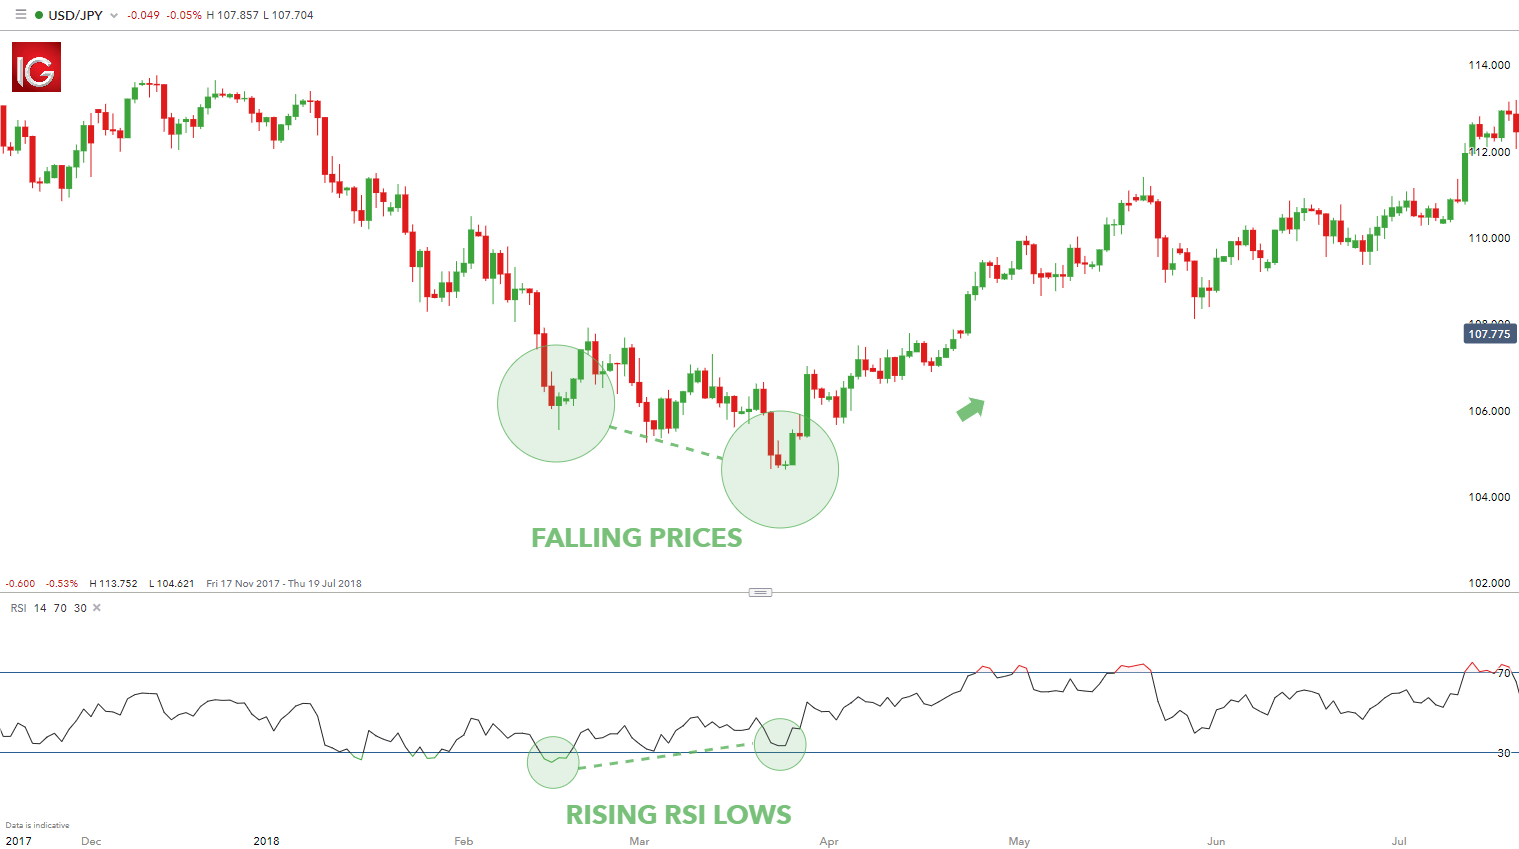
Divergence is another valuable way to use the RSI indicator. Divergence is a tool used to spot potential reversals by comparing the movement between indicator and market direction. The charts below illustrate positive (bullish reversal) and negative (bearish reversal) divergence signals.
3. Positive divergence USD/JPY - The USD/JPY chart exhibits falling prices along with rising RSI levels signalling a reversal in trend to the upside.
4. Negative divergence USD/JPY - The USD/JPY chart exhibits rising prices along with falling RSI levels signalling a reversal in trend to the downside.

Relative Strength Index: A Summary
RSI measures the relative strength of the market, making this oscillator an invaluable tool that can be employed in virtually any market. The multiple ways of utilising the RSI allows for traders to become flexible within their trading strategy. Every novice technical trader should definitely have the RSI incorporated into their repertoire.
Become a Better Trader with Our Trading Tips
- Take a look at trading with the RSI and find examples of RSI for trend trading
- If you’re new to forex trading, download our forex for beginners trading guide
- Stay up to date with major news events and economic releases by viewing our economic calendar .
- Successful trading requires sound risk management and self-discipline. Find out how much capital you should risk on your open trades.
- Read through upcoming articles on the exponential moving average and 200-day moving average
- We also recommend viewing our ’Traits of Successful Traders’ guide to discover the secrets of successful forex traders.