


Ethereum (ETH/USD) Prices, Charts, and Analysis
- Ethereum – 3rd time lucky at resistance?
- Bull flag formation sets the tone.

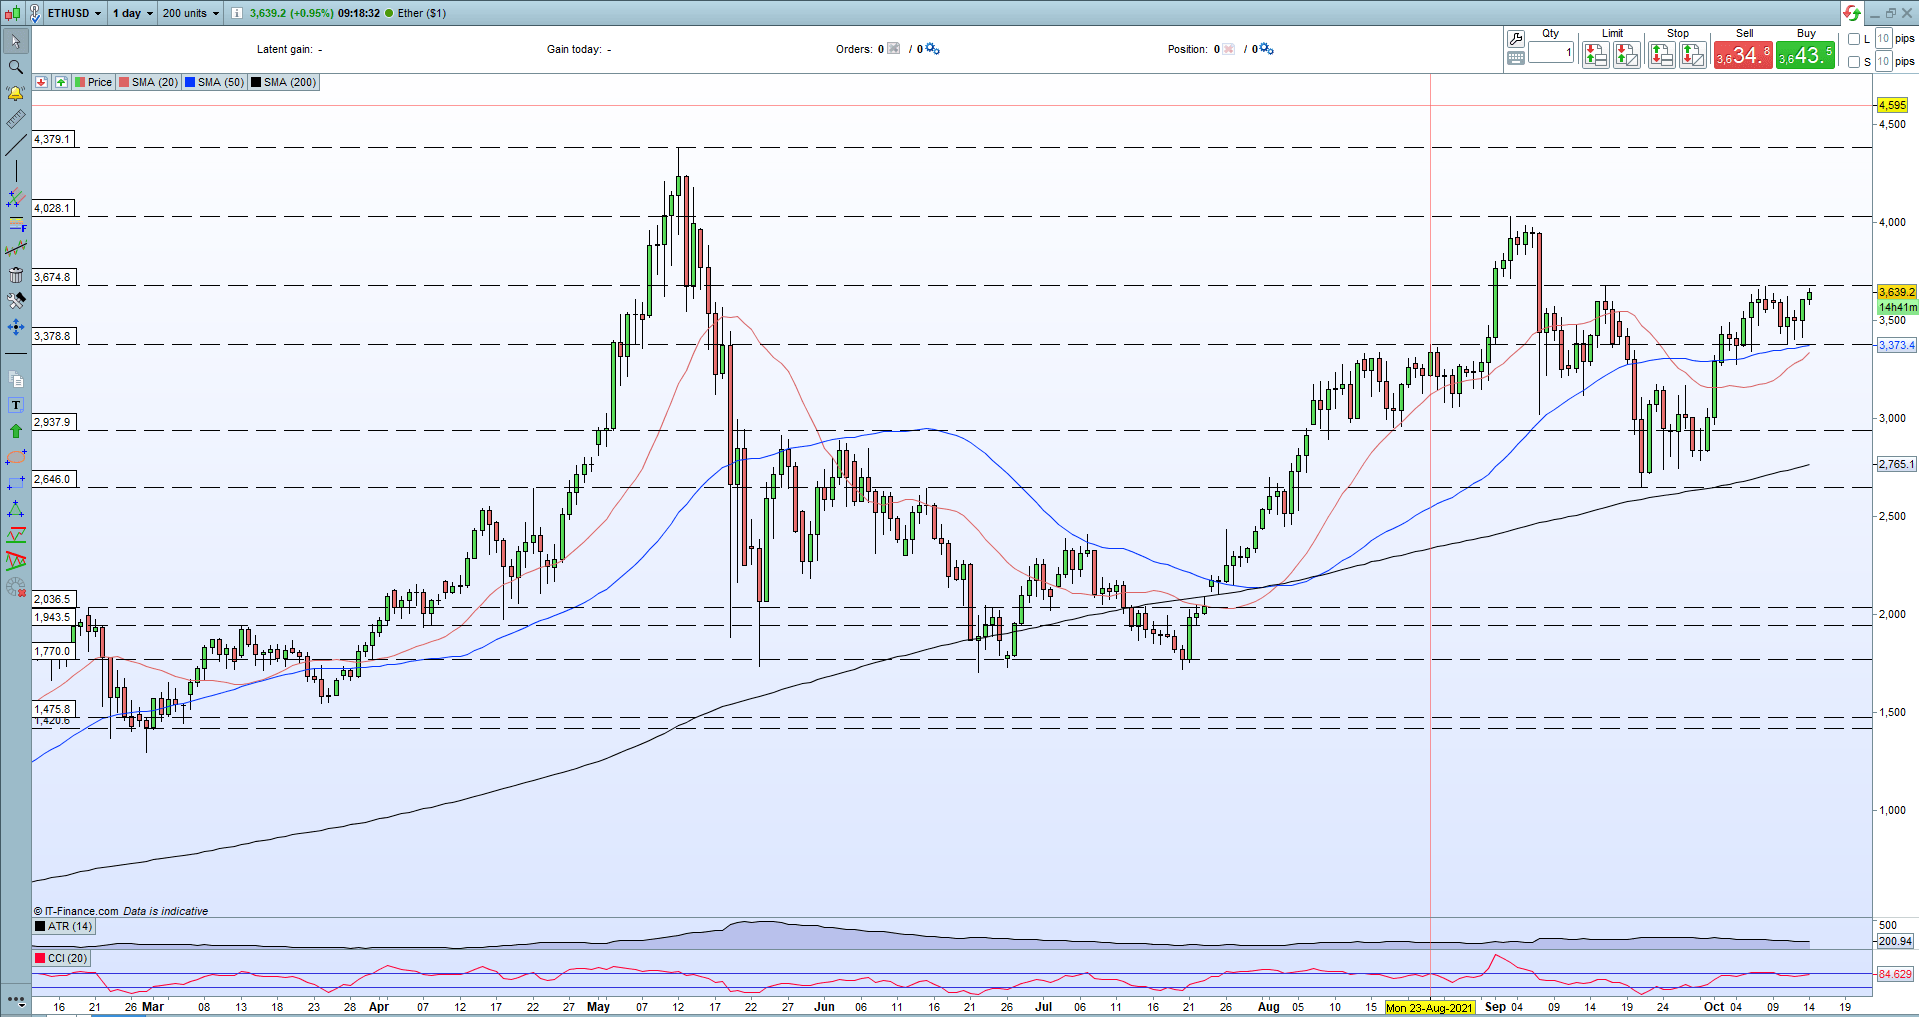
Ethereum is threatening to break through multi-week resistance as the second-largest cryptocurrency turns higher. ETH has lagged Bitcoin over the last few days, pushing the ETH/BTC spread back down to a multi-week low of 600, but this underperformance is now starting to turn, leaving Ethereum close to a technical resistance level.
Bitcoin (BTC) Grinding Back to Multi-Month Highs, Volt ETF Offers Crypto Diversification
The cryptocurrency market as a whole is also growing and is not too far off its record high printed in mid-May this year. The recent move has been lead by Bitcoin but a raft of other coins are now moving higher, with strong, single-digit percentage gains seen today.
Cryptocurrency Market Total Capitalization – October 14, 2021
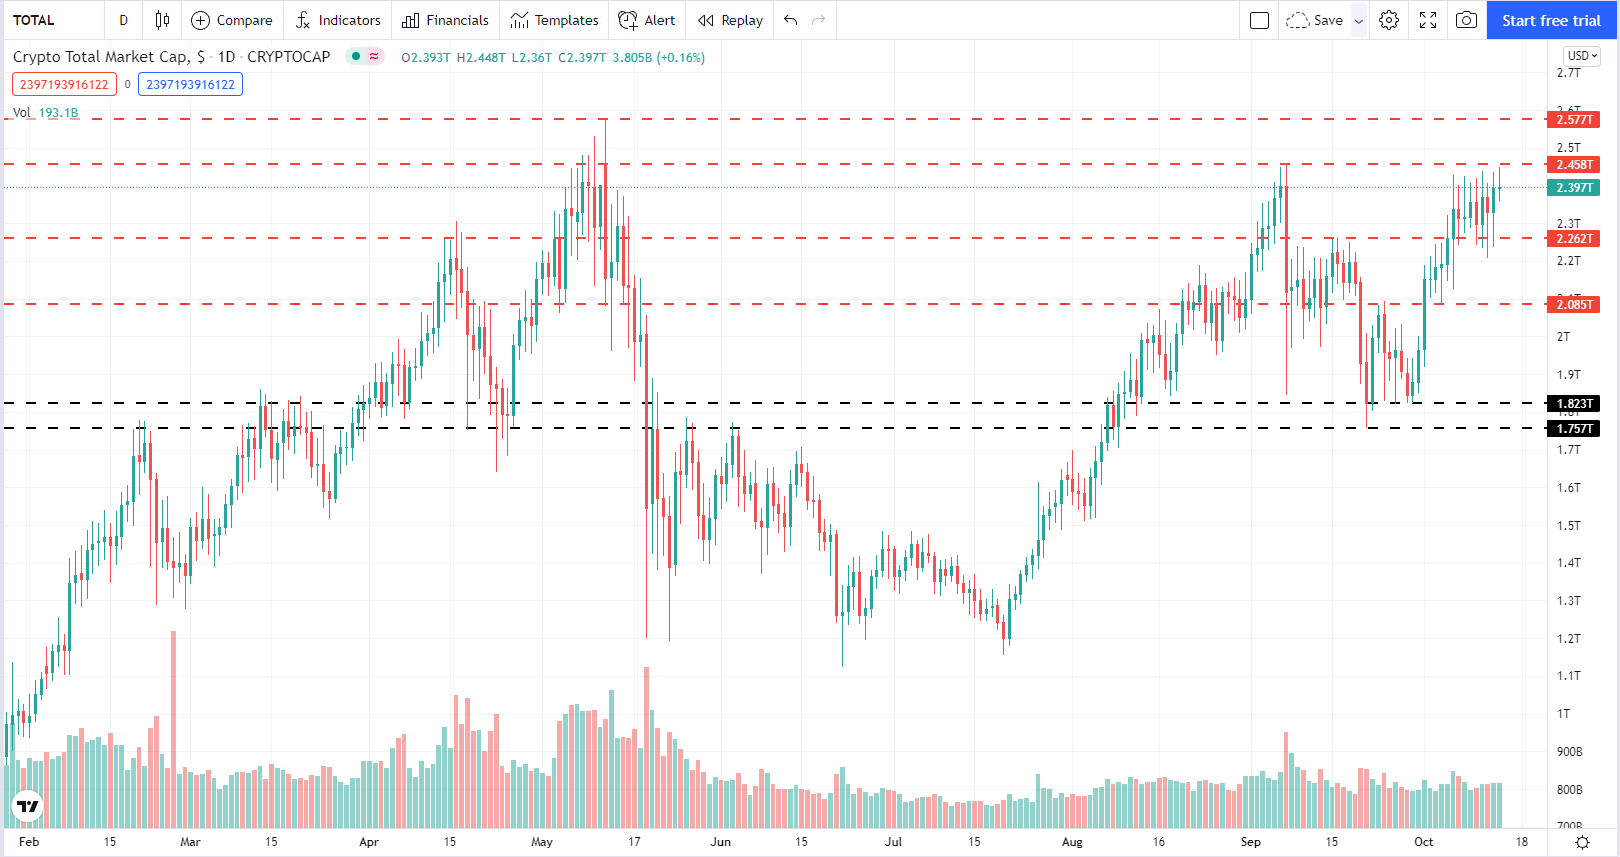
Chart via TradingView.com
While Ethereum may still lag Bitcoin over the last seven days, the latest move higher sees multi-week resistance now under threat. Horizontal resistance at $3,675 has held the last two attempts but it looks increasingly likely that it will third time lucky for the bulls. The bullish scenario is helped by the recent upturn in all three simple moving averages, with the 20-day sma just about to finish off a bullish set-up, while Ethereum’s price action over the last two weeks has set up a bullish flag pattern, another driver of higher prices. A break and open above $3,675 will set-up $4,028 as the next target, with little resistance seen between these two levels, before $4,379 comes into play.
How to Trade Bullish Flag Patterns
Ethereum (ETH/USD) Daily Price Chart - October 14, 2021
What is your view on Ethereum (ETH) – bullish or bearish?? You can let us know via the form at the end of this piece or you can contact the author via Twitter @nickcawley1.
https://www.dailyfx.com/education/technical-analysis-chart-patterns/bull-flag.html


