


Bitcoin (BTC/USD) Price Update:
- Bitcoin (BTC) bulls break $50,000
- US Dollar (USD) recovers after NFP (non-farm-payroll) shock
The analysis contained in article relies on price action and chart formations. To learn more about price action or chart patterns, check out our DailyFX Education section.

Bitcoin (BTC/USD) Bulls Take a Breather Below $52,000
After two consecutive months of gains, Bitcoin (BTC) bulls managed to drive price action above prior resistance at $50,000 until stumbling into the key psychological level of $52,000.
The move comes after the release of the highly anticipated US NFP (non-farm payrolls) report which serves as the key employment metric for the Federal Reserve.
Despite the formation of a spinning-top on Thursday, the discouraging job data dampened expectations for the Federal Reserve to announce plans of tapering back on bond purchases at next FOMC meeting on 22 September despite rising inflation.
Upon release of the report on Friday, USD weakness and a shift in risk sentiment enabled BTC/USD to continue along its recent upward trajectory.
However, as the United States celebrates labor day, a slight recovery in the USD hindered bulls ability to gain traction above the next key psychological resistance level of $52,000.

With global interest rates at near-record lows, inflationary pressures continue to rise while the spread of the delta variant continues to disrupts the recovery process. The fundamental backdrop appeared to be a positive catalyst for the crypto sphere allowing Bitcoin to retest May levels.
Bitcoin (BTC/USD) Price Analysis:
At the time of writing, Bitcoin bulls are currently resting above $51,000 while bears struggle to push prices back below the critical support level of $50,000.
As bulls and bears continue to fight for posession over the systemic, dominant trend, shorter candles suggest that the strength of the rally may be losing steam as it now faces additional resistance from key Fibonacci levels of the 2020-2021 move.
For now, prices remain above the 20-day moving average while a crossover of the MACD (moving average convergence/divergence) above the zro-line suggests that a breakout towards the upside is still probable.
Bitcoin (BTC/USD) Daily Chart
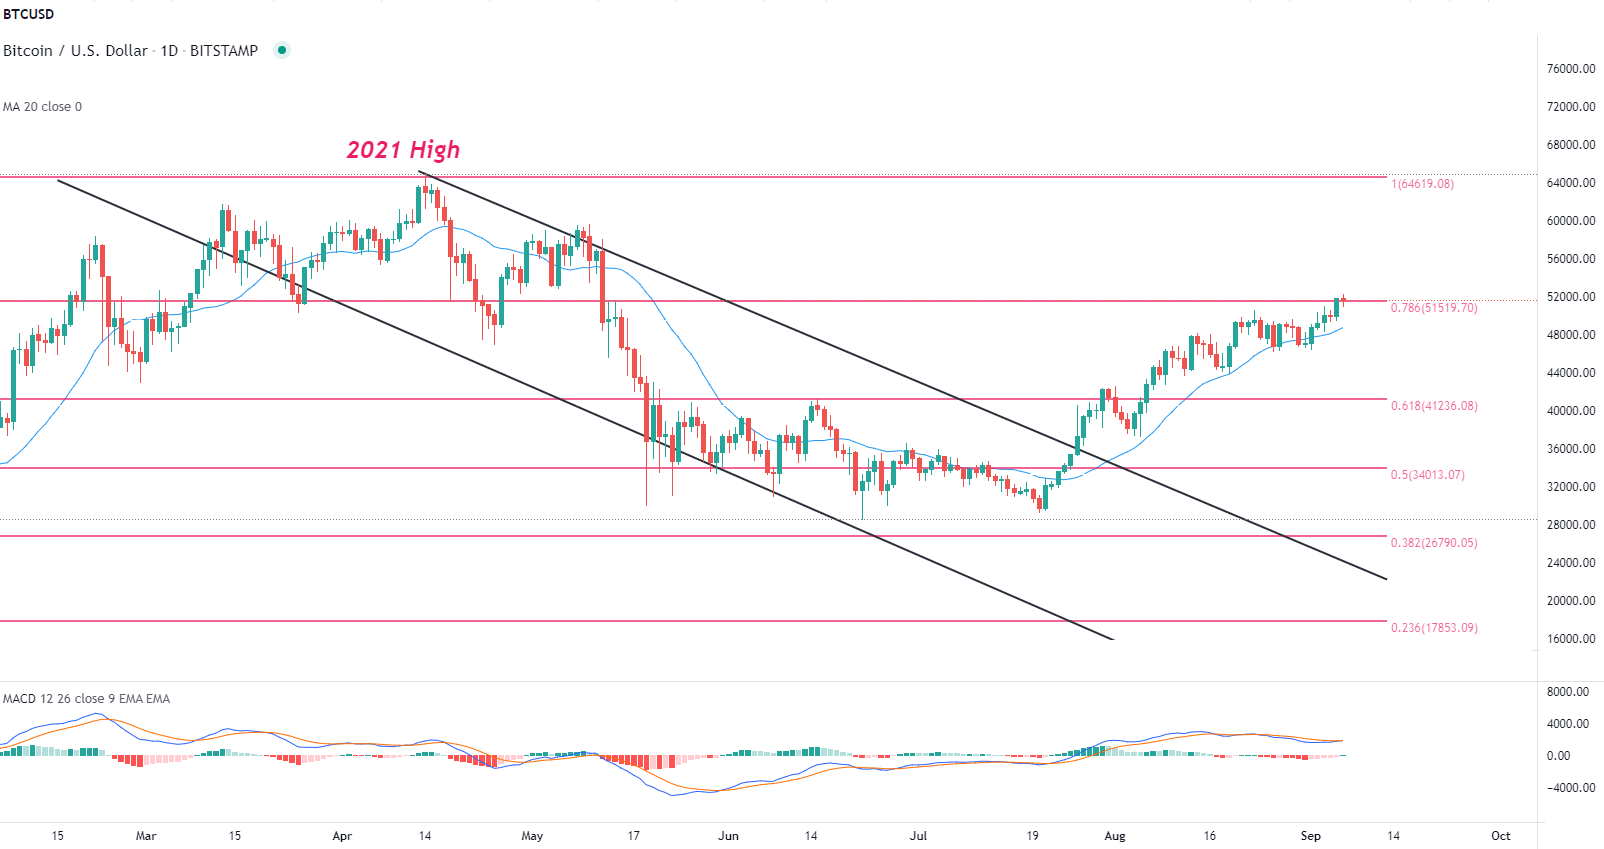
Chart prepared by Tammy Da Costa using TradingView
Likewise, the weekly chart below shows price action above the 20-period moving-average with the MACD crossing back above the zero-line, suggestive that the trend remains towards the upside, at least for now.
Bitcoin (BTC/USD) Weekly Chart

Chart prepared by Tammy Da Costa using TradingView
--- Written by Tammy Da Costa, Analyst for DailyFX.com
Contact and follow Tammy on Twitter: @Tams707


