


Bitcoin (BTC/USD) Price Action:
- Bitcoin bounce back from $40,000
- USD weakness and institutional interest have supported this week’s crypto rebound
- BTC/USD remains supported by key technical indicators

Bitcoin (BTC/USD) and other major cryptocurrencies re-appeared in the headlines this week as a combination of crowd psychology and speculation briefly drove the price of BTC/USD to the June high before retreating back below the critical level of resistance, formed by the key psychological price of $40,000.
As US earning season continued to focus on the performance of large tech stocks, crypto influencers Cathie Wood of ARK invest, Tesla CEO Elon Musk and Twitter CEO Jack Dorsey participated in the ‘B Word’ conference panel discussion that took place last weekend, maintaining a bullish narrative for the crypto sphere.
Elon Musk Tweets: The Impact of Social Media on Markets
Although Bitcoin prices enjoyed double-digit gains at the start of the week, Amazon’s denial of allegations that the group would be accepting Bitcoin as a payment method by the end of the year hindered the ability for bulls to maintain favor above $40k.
Bitcoin (BTC/USD) Price Action
After opening above trendline resistance at the start of the week, Bitcoin prices pushed through $40,000, rallying into a wall of resistance just below $41,000. After retreating back to $39,000, bulls and bears continued to fight over dominance as price action temporarily stalled between the 8 and 34-period Exponential Moving Averages (EMA).
Bitcoin (BTC/USD) Daily Chart
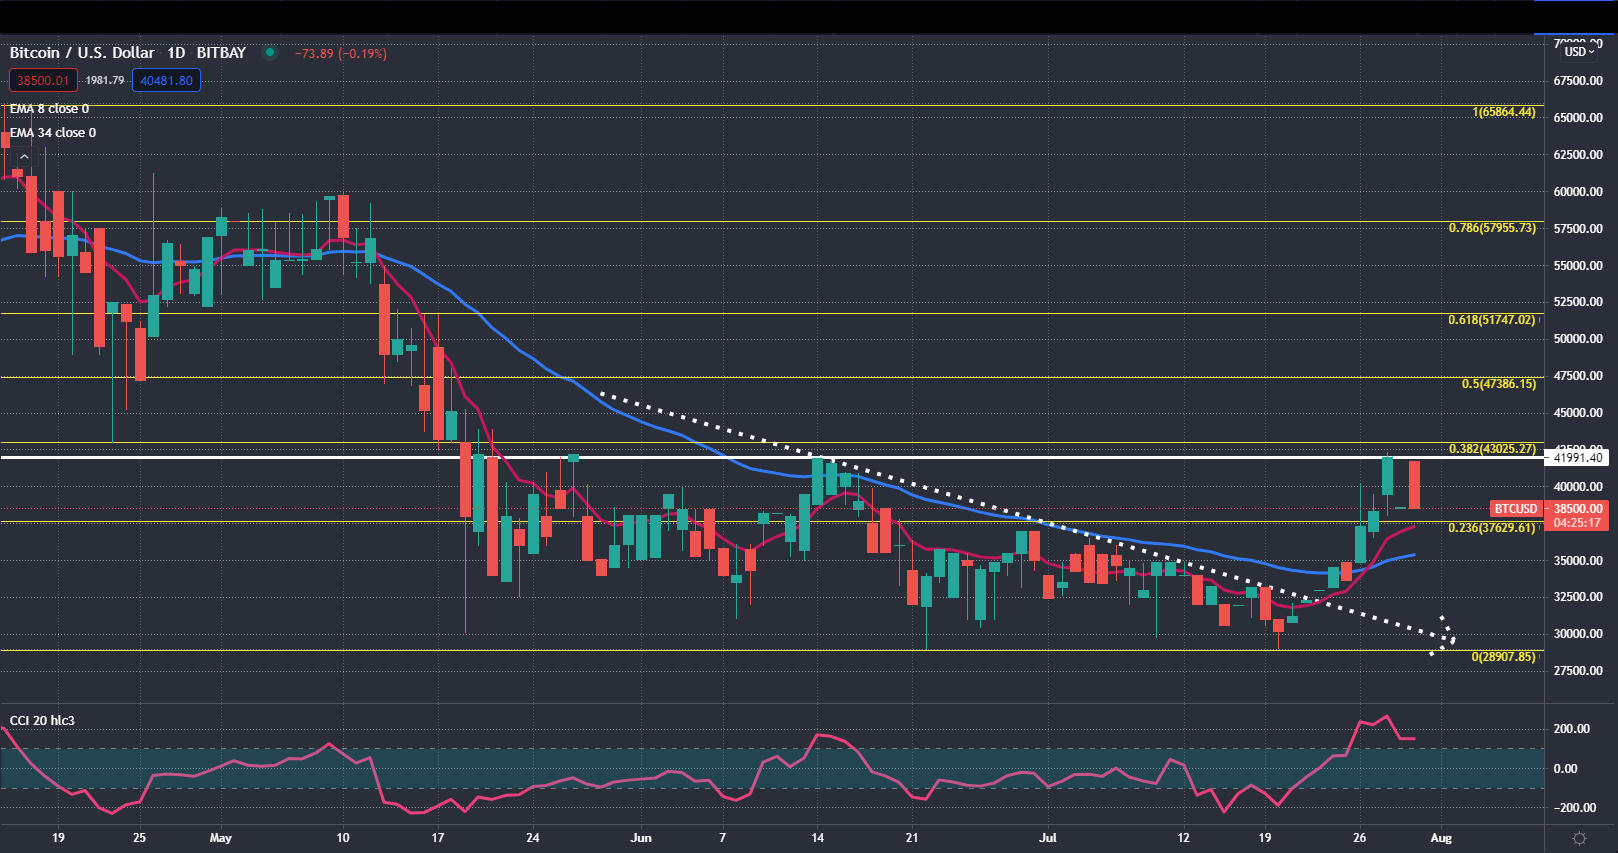
Source: TradingView, Chart by Tammy Da Costa
The below 4-hour chart further illustrates the narrow range of recent price action around the $39,000 mark. With the recent formation of shorter candles indicating a potential decline in the momentum of the trend, the key levels of support and resistance for the imminent move remain between $38,000 and $40,000, at least for now.

Bitcoin (BTC/USD) 4-Hour Chart

Chart Prepared by Tammy Da Costa using IG Charts
For now, a break of $40,000 could see Bitcoin prices testing the next level of resistance at $42,293, the 38.2% Fibonacci retracement level of the April – June 2021 move.
In contrast, selling pressure may gain traction if prices fall below $37,000 with bearish an increase in bearish momentum bringing $33,000 back into play.
--- Written by Tammy Da Costa, Analyst for DailyFX.com
Contact and follow Tammy on Twitter: @Tams707


