


Key Talking Points:
- Bitcoin drops more than 40% since Coinbase DPO
- Losses in the crypto space accelerate as China bans digital currencies
- Ethereum struggling to find support
This month is shaping out to be one of the worst on record for cryptos. The listing of Coinbase seems to have been the starting point of their weakness - Bitcoin is down 40% since the DPO – but ongoing concerns about their stability and safety have kept sellers coming.
After Turkey’s Central Bank was strict about not embracing digital currencies, the latest country to cast doubt on cryptocurrencies is China, with the government reiterating that they cannot be used as a form of payment, prohibiting financial and payments institutions from pricing products or services with virtual currencies.
As I mentioned in a previous report, the listing of Coinbase was seen as an acceptance of digital currencies from financial markets, which means cryptos have entered somewhat of a phase of maturity. I focused on how with this embracement comes to some extent a lack of excitement about digital currencies as being the newest financial trend, which would enable prices to settle more in the long term. We could be in the midst of that happening as prices return to more sustainable long-term levels. Then again, this pullback could have nothing to do with that, and it is simply a temporary correction to settle overbought conditions.
BTC/USD Daily chart
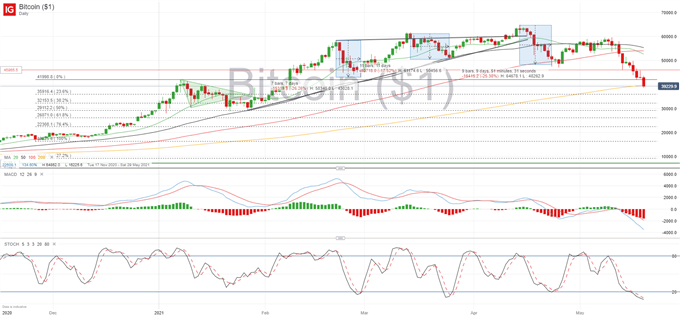
As can be seen on the daily BTC/USD chart, Bitcoin price is now below the high seen in January 2021 after a few months of steady growth post-pandemic. This is probably one of the most steady price points we can use as a reference, given how cryptos have been on a volatile path since then. We can see how Monday’s retracement attempted to regain a footing at this level, but a rejection from buyers has put Bitcoin under further selling pressure, having fallen below $40,000 for the first time since February 8th.
Momentum indicators are showing strong oversold conditions but we could see a further pullback before buyers step in. The strong correction over the last 9 days has definitely made prices more attractive for new buyers, but it will have also left some investors licking their wounds, so I doubt we see a strong rebound in the coming sessions. We may see price drift sideways if new participants show up, but there is still further downside to be had in the short term, with 35,900 (23.6% Fibonacci) as a possible objective.

Ethereum Daily Chart
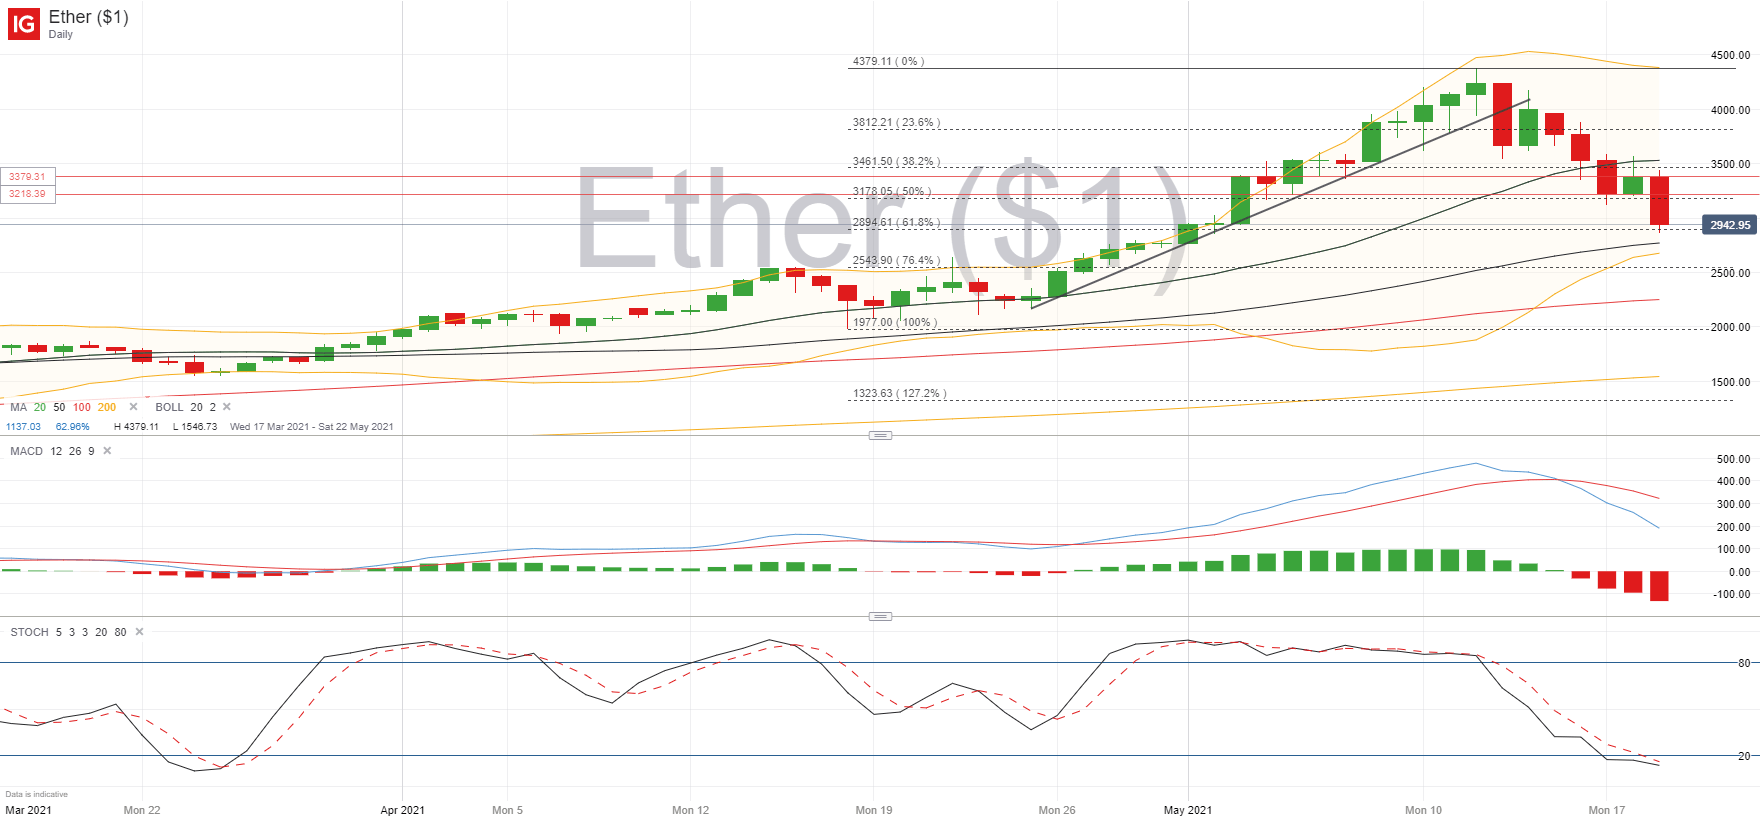
With regards to Ethereum (ETH/USD), momentum only turned negative about a week ago, as the leading alt-coin was holding on to gains despite Bitcoin’s evident weakness. But it hasn’t been able to hold out for long as the overall negative sentiment has caught up to ETH/USD, bringing it below $3,000 just two weeks after it crossed above it for the first time.
We saw an attempt in yesterday’s session to hold above 3,218 an area I had previously marked as key support, but the bounce was short-lived and the coin ended the session just below another key are at 3,379. As with Bitcoin, momentum indicators are showing oversold conditions, although the intensity is lower with Ethereum, which may suggest that there are further losses to come as it catches up with other cryptos.
How to Read a Candlestick Chart
Learn more about the stock market basics here or download our free trading guides.
--- Written by Daniela Sabin Hathorn, Market Analyst
Follow Daniela on Twitter @HathornSabin


