


- Reviewed by Nick Cawley, August 1, 2022
Reading candlestick charts – Talking points:
- Candlestick charts differ greatly from the traditional bar chart
- Traders generally prefer using candlestick charts for day-trading because they offer an enjoyable visual perception of price
- It’s important to understand the key components of a candle, and what they indicate, to apply candlestick chart analysis to a trading strategy
What is a candlestick chart?
A candlestick chart is simply a chart composed of individual candles, which traders use to understand price action. Candlestick price action involves pinpointing where the price opened for a period, where the price closed for a period, as well as the price highs and lows for a specific period.
Price action can give traders of all financial markets clues to trend and reversals. For example, groups of candlesticks can form patterns which occur throughout forex charts that could indicate reversals or continuation of trends. Candlesticks can also form individual formations which could indicate buy or sell entries in the market.
The period that each candle depicts depends on the time-frame chosen by the trader. A popular time-frame is the daily time-frame, so the candle will depict the open, close, and high and low for the day. The different components of a candle can help you forecast where the price might go, for instance if a candle closes far below its open it may indicate further price declines.
Boost your chart patterns expertise with our interactive quiz!
Our Forex Trading Patterns Quiz will test your knowledge of some of the most important trading patterns. Take the test today by clicking on the link and raise your technical analysis game!
Interpreting a candle on a candlestick chart
The image below represents the design of a typical candlestick. There are three specific points (open, close, wicks) used in the creation of a price candle. The first points to consider are the candles’ open and close prices. These points identify where the price of an asset begins and concludes for a selected period and will construct the body of a candle. Each candle depicts the price movement for a certain period that you choose when you look at the chart. If you are looking at a daily chart each individual candle will display the open, close, upper and lower wick of that day.
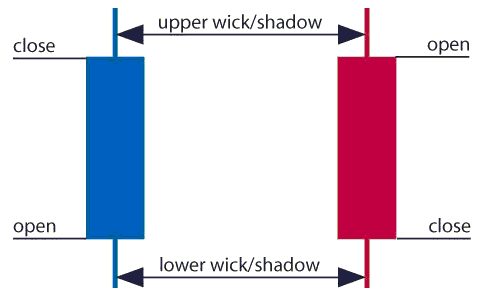
Open price:
The open price depicts the first price traded during the formation of the new candle. If the price starts to trend upwards the candle will turn green/blue (colors vary depending on chart settings). If the price declines the candle will turn red.
High Price:
The top of the upper wick/shadow indicates the highest price traded during the period. If there is no upper wick/shadow it means that the open price or the close price was the highest price traded.
Low Price:
The lowest price traded is the either the price at the bottom of the lower wick/shadow and if there is no lower wick/shadow then the lowest price traded is the same as the close price or open price in a bullish candle.
Close Price:
The close price is the last price traded during the period of the candle formation. If the close price is below the open price the candle will turn red as a default in most charting packages. If the close price is above the open price the candle will be green/blue (also depends on the chart settings).
The Wick:
The next important element of a candlestick is the wick, which is also referred to as a ‘shadow’. These points are vital as they show the extremes in price for a specific charting period. The wicks are quickly identifiable as they are visually thinner than the body of the candlestick. This is where the strength of candlesticks becomes apparent. Candlesticks can help traders keep our eye on market momentum and away from the static of price extremes.
Direction:
The direction of the price is indicated by the color of the candlestick. If the price of the candle is closing above the opening price of the candle, then the price is moving upwards and the candle would be green (the color of the candle depends on the chart settings). If the candle is red, then the price closed below the open.
Range:
The difference between the highest and lowest price of a candle is its range. You can calculate this by taking the price at the top of the upper wick and subtracting it from the price at the bottom of the lower wick. (Range = highest point – lowest point).
Having this knowledge of a candle, and what the points indicate, means traders using a candlestick chart have a clear advantage when it comes to distinguishing trendlines, price patterns and Elliot waves.
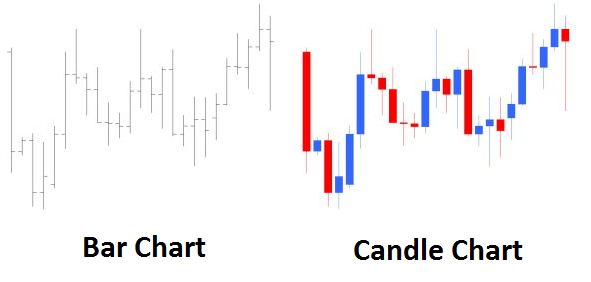
Bar Chart vs Candlestick Chart
As you can see from the image below, candlestick charts offer a distinct advantage over bar charts. Bar charts are not as visual as candle charts and nor are the candle formations or price patterns. Also, the bars on the bar chart make it difficult to visualize which direction the price moved.

How to read a candlestick chart
There are various ways to use and read a candlestick chart. Candlestick chart analysis depends on your preferred trading strategy and time-frame. Some strategies attempt to take advantage of candle formations while others attempt to recognize price patterns.
Interpreting single candle formations
Individual candlesticks can offer a lot of insight into current market sentiment. Candlesticks like the Hammer, shooting star, and hanging man, offer clues as to changing momentum and potentially where the market prices maytrend.
As you can see from the image below the Hammer candlestick formation sometimes indicates a reversal in trend. The hammer candle formation has a long lower wick with a small body. Its closing pricing is above its opening price. The intuition behind the hammer formation is simple, price tried to decline but buyers entered the market pushing the price up. It is a bullish signal to enter the market, tighten stop-losses or close out a short position.
Traders can take advantage of hammer formations by executing a long trade once the hammer candle has closed. Hammer candles are advantageous because traders can implement ‘tight’ stop-losses (stop-losses that risk a small amount of pips). Take-profits should be placed in such a way as to ensure a positive risk-reward ratio. So, the take-profit is larger than the stop-loss.

Recognizing price patterns in multiple candles
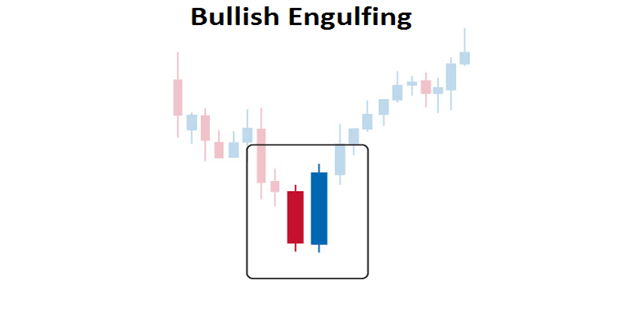
Candlestick charts help traders recognize price patterns that occur in the charts. By recognizing these price patterns, like the bullish engulfing pattern or triangle patterns you can take advantage of them by using them as entries into or exit signals out the market.
For example, in the image below we have the bullish engulfing price pattern. The bullish engulfing is a combination of a red candle and a blue candle that ‘engulfs’ the entire red candle. It is an indication that it could be the end of a currency pairs established weakness. A trader would take advantage of this by entering a long position after the blue candle closes. Remember, the price pattern only forms once the second candle closes.
As with the hammer formation, a trader would place a stop loss below the bullish engulfing pattern, ensuring a tight stop loss. The trader would then set a take-profit. For more forex candlestick charts check our forex candlesticks guide where we go in depth into the advantages of candlestick charts as well as the strategies that can be implemented using them.

Further tips for reading candlestick charts
When reading candlestick charts, be mindful of:
At DailyFX we offer a range of forecasts on currencies, oil, equities and gold that can aide you in your trading. It is also worth following our webinars where we present on a variety of topics from price-action to fundamentals that may affect the market.


