


Bitcoin (BTC/USD) Price, Analysis and Chart:
- Bullish channel is broken in a two day sell-off.
- No specific driver of price action.

Another wave of indiscriminate selling in the cryptocurrency market has slammed prices lower across the board with double-digit losses registered everywhere. This wave follows yesterday’s heavy sell-off, and partial retrace, amid talk that leveraged accounts were moving out of the market after recent heavy gains. As always with the cryptocurrency market, volatility and rumor go hand in hand and, while currently unlikely, any news about another corporation entering the market or adopting Bitcoin could easily reverse these losses quickly. However, as we speak sellers have complete control of the space with some major coins falling by 20%+ and it would be foolish to try and counter this current trend.
How to Manage the Emotions of Trading
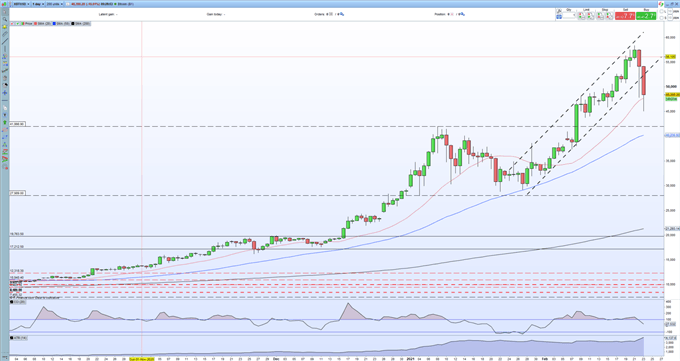
The latest sell-off has changed the technical outlook for Bitcoin (BTC/USD) with the bullish ascending channel from late-January now broken. Monday’s ‘hanging man’ candlestick is another bearish chart signal and suggests a trend reversal, although the 20-day simple moving average may lend support to current price action if closed above today. The ATR indicator shows Bitcoin volatility at a record high while the CCI reading shows the market is fairly neutral in terms of sentiment.
Top 10 Candlestick Patterns to Trade the Markets
Bitcoin (BTC/USD) Daily Price Chart (October 2020 - February 23, 2021)
Traders of all levels and abilities will find something to help them make more informed decisions in the new and improved DailyFX Trading Education Centre
What are your views on Bitcoin (BTC) – bullish or bearish?? You can let us know via the form at the end of this piece or you can contact the author via Twitter @nickcawley1.


