Gold (XAU/USD) Analysis, Price and Chart
- Gold trades above $1,900/oz. before selling off sharply.
- Markets under pressure as riskier-assets shunned.
Gold is swinging around in early Monday trade as risk-markets come under pressure in holiday-thinned trading conditions. The precious metal has been moving higher of late and traded back above $1,900/oz. earlier today before sellers forced the price back down to just above $1,8500/oz. in around 30 minutes. This sell-off came despite a strong risk-off market theme as rising Covid-19 numbers, and mutations, unsettled investors.
British Pound Outlook: Covid Mutation, Brexit Talks Undermine GBP/USD
Oil, a recent barometer of risk, fell by around 5% in early turnover while copper also fell by 3%-4%, despite ongoing Chinese buying interest. S&P futures also fell sharply in pre-US trade, registering losses in excess of 2%. The US dollar broke its recent losing streak and rose by around 0.60% to 90.55, its highest level in 10 days.
Coming Soon – Download the New 1st Quarter Trading Forecast from the Free Trading Guides Page!!
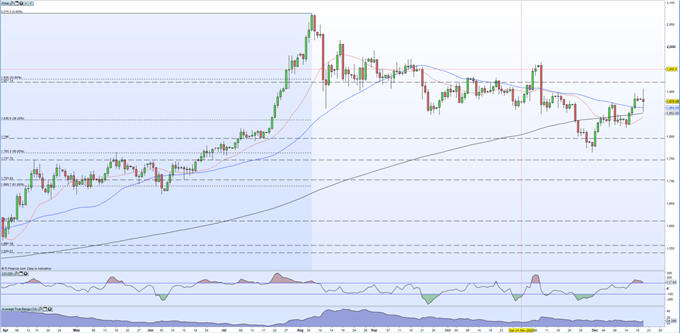
On the back of the uptick in the US dollar, gold turned sharply lower today before trimming its losses. The precious metal lost around $40/oz. in 30 minutes mid-morning, hitting a $1,855/oz. low. The daily chart shows gold making a long-legged doji today, which, when combined with an overbought CCI signal and a bearish contrarian IG sentiment suggests that gold may struggle to move higher.


Gold Daily Price Chart (April – December 21, 2020)

| Change in | Longs | Shorts | OI |
| Daily | 1% | -3% | -1% |
| Weekly | 2% | -8% | -2% |
IG retail trader data show 80.22% of traders are net-long with the ratio of traders long to short at 4.05 to 1.We typically take a contrarian view to crowd sentiment, and the fact traders are net-long suggests Gold prices may continue to fall.Traders are further net-long than yesterday and last week, and the combination of current sentiment and recent changes gives us a stronger Gold-bearish contrarian trading bias.
What is your view on Gold – are you bullish or bearish?? You can let us know via the form at the end of this piece or you can contact the author via Twitter @nickcawley1.


