


S&P 500 Index, Trader Positioning, Market Sentiment Talking Points
- Options traders shift to protective stance according to CBOE’s Put/Call Ratio
- Market conditions deteriorate following upbeat Non-farms payroll data
- IG Client Sentiment data shows retail shifting more bullish on S&P 500
Volatility continues to drive market pricing Friday after a stellar jobs report earlier this morning. This follows a brutal session from Thursday with the index notching a 3.51 percent decline, the worst performance since early June. Currently, the S&P 500 index is down 2.5% as post-NFP enthusiasm quickly faded, dragging the markets back into a risk-off tilt. The tech-heavy Nasdaq index is leading the pack lower, with the NDX index down 4.44%, while the VIX index accelerates higher.
S&P 500 Index, NDX Index, VIX Index (15-Min Chart)
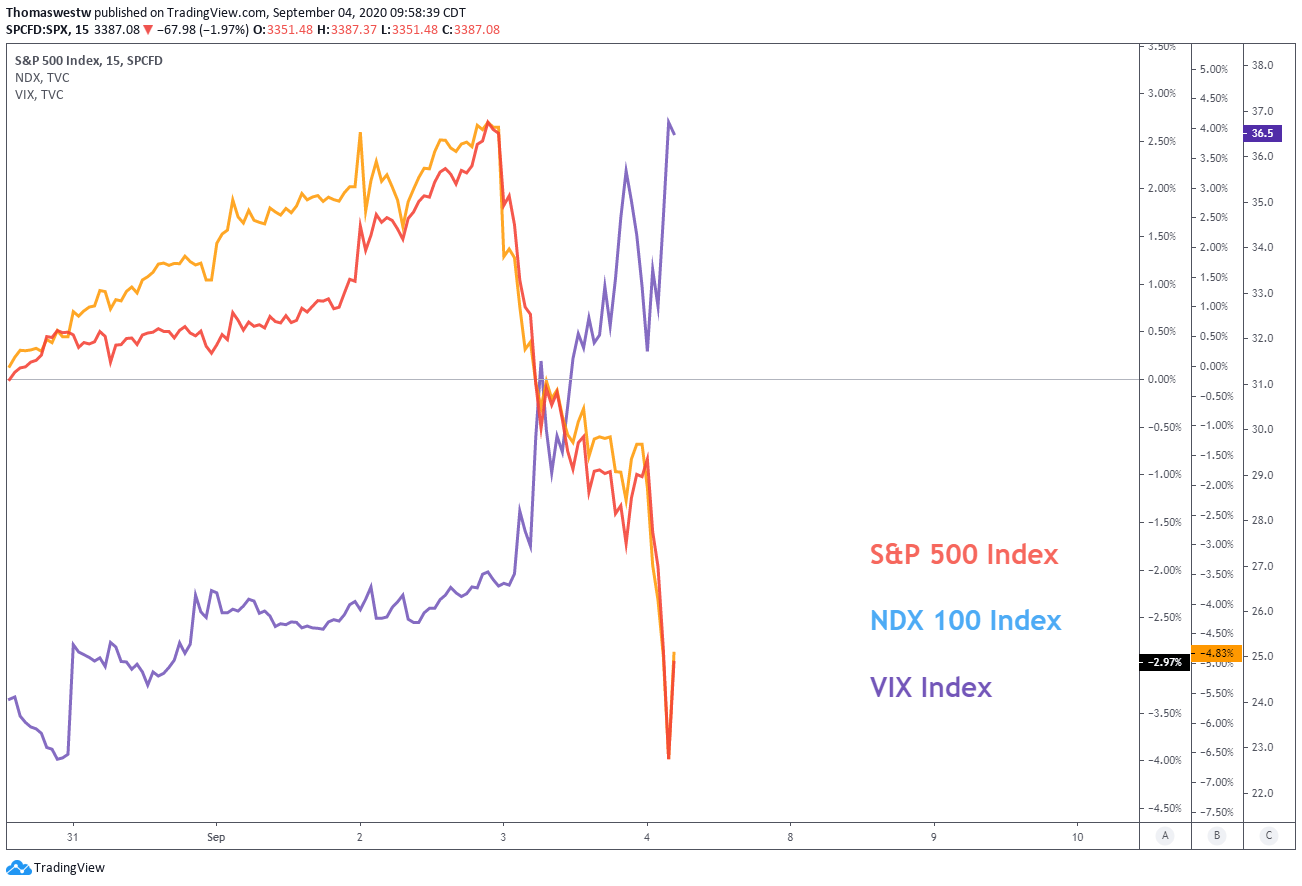
Chart created by Thomas Westwater with TradingView
The warning signs for a bout of risk-aversion flashed across markets earlier this week, with the VIX index creeping higher before Thursday. September is also known to be a bearish month, by historical standards. Consequently, cautious market participants may have unwound some risk-exposure earlier this week, but given the volatility, the move likely caught most traders off-guard.
S&P 500 Index VS CBOE SPX Total Put/Call Ratio (Daily Time Frame)
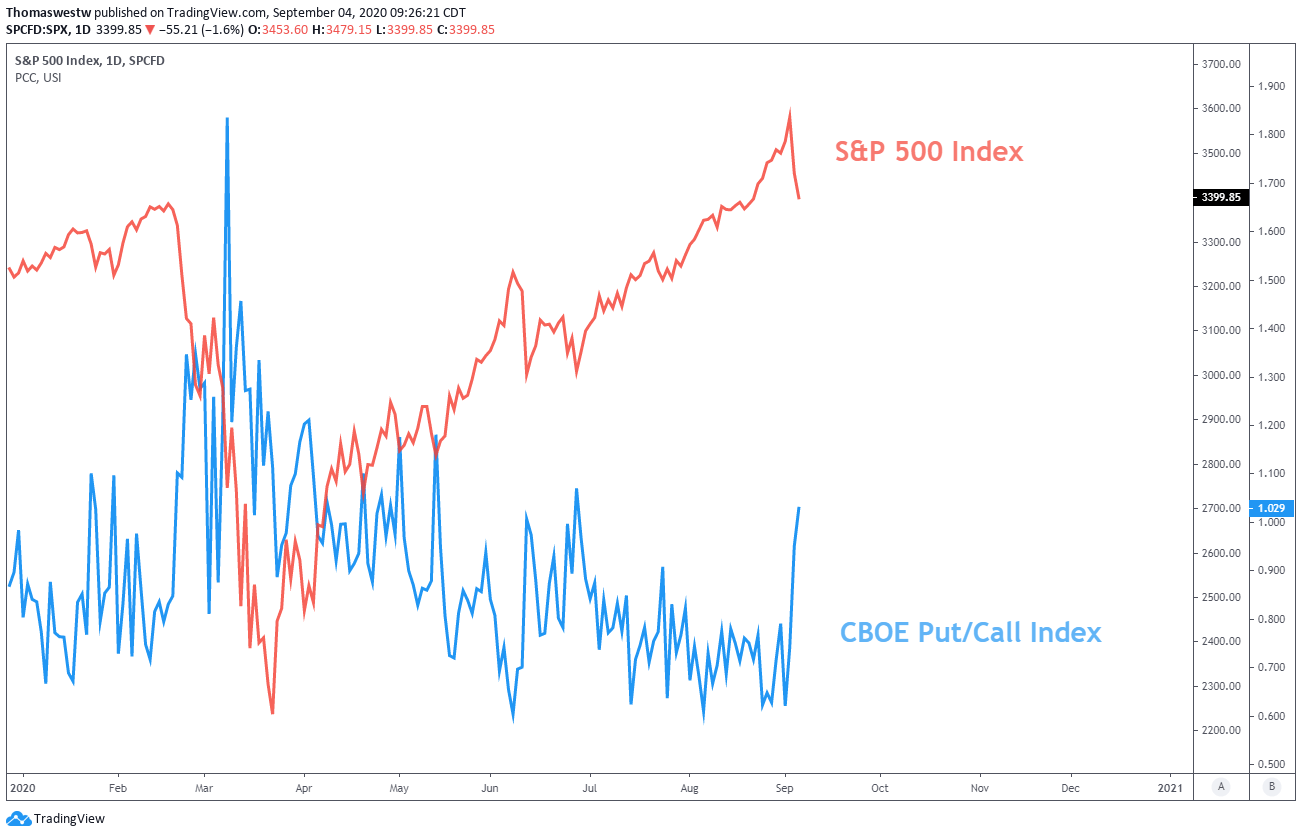
Chart created by Thomas Westwater with TradingView
Examining trader positioning, particularly following risk-off events reveals useful information for traders. One useful metric is the CBOE’s Put/Call ratio, which measures the volume of put options traded against call options. Simply put, a ratio under 1.0 suggest options traders are positioned on the bullish side, and over 1.0, to the bearish side. Still, the directional trend in the ratio is equally important to analyze.

Thursday’s opening bell had the total put/call ratio at 0.74, before rising to 0.95 by the close of the trading session. The increasing ratio suggest traders started buying puts for downside protection as the market dropped and/or sold their call positions. This morning’s NFP report briefly pushed the ratio lower, but as market conditions deteriorated, the put/call ratio rose above the 1.00 level, indicating traders are now positioned for bearish conditions.
S&P 500 Index vs IG Client Sentiment (Daily Chart)
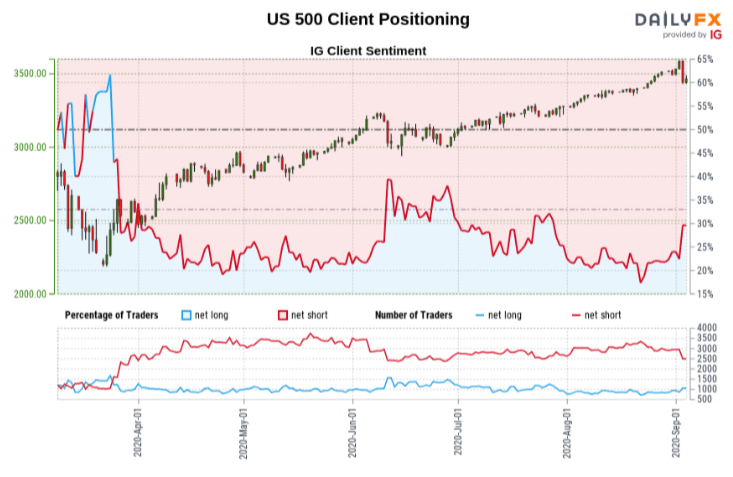
Looking at the retail CFD crowd, we can use the IG Client Sentiment data to view trader positioning in the S&P 500 index. The latest IGCS report shows 33.12% of traders are net-long, a 34.34% increase from yesterday. And net-short positioning dropped 18.22% from Thursday. This movement in client positioning hints that the S&P 500 index may continue to drop when viewed through a contrarian viewpoint.
--Written by Thomas Westwater, Contributor for DailyFX.com
Contact and follow Thomas on Twitter @FxWestwater


