


S&P 500 PRICE OUTLOOK: STOCKS STILL SOARING BUT SO IS EXPECTED MARKET VOLATILITY
- S&P 500 price closes at another all-time high as stocks continue their melt-up
- VIX Index has conspicuously advanced alongside the S&P 500 over recent sessions
- VIX seasonality points to elevated readings of expected volatility during Fall months
S&P 500 price action just set a new record high close yet again now resting at the 3,526-mark. Stocks look like they are in melt-up mode as the S&P 500 and Nasdaq rise relentlessly. Investor risk appetite might have been fueled most recently by overall solid manufacturing PMI data released this morning. Though the atypical positive relationship displayed by the S&P 500 Index and VIX ‘fear-gauge’ over the last few trading sessionsstands out as a bit odd.
| Change in | Longs | Shorts | OI |
| Daily | 1% | -1% | 0% |
| Weekly | 15% | -13% | -1% |
S&P 500 PRICE CHART WITH VIX INDEX OVERLAID: 15-MINUTE TIME FRAME (26 AUG TO 01 SEP 2020)
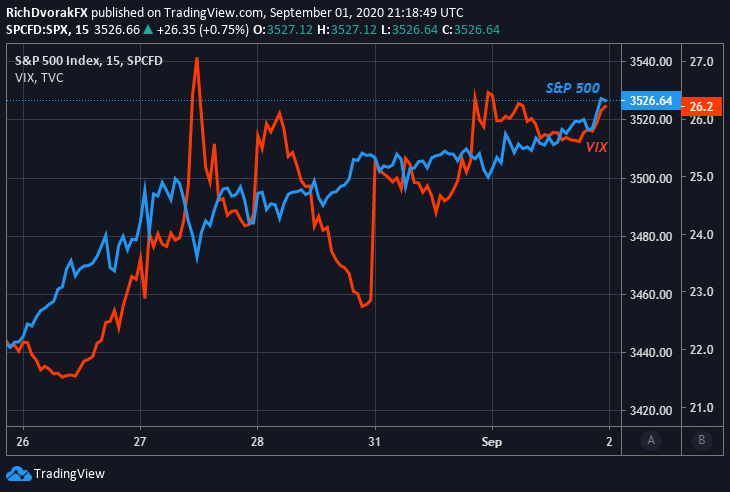
Chart created by @RichDvorakFX with TradingView
In the midst of stocks hitting fresh all-time highs, however, one possible explanation for the lockstep move between S&P 500 price action and the VIX could be rising investor demand for downside protection as they hedge against growing bubble-like conditions. Also, as traders turn their calendars to September and venture out of the summer doldrums, it is worth mentioning how average VIX seasonality points to an upcoming period of elevated market volatility.

CHART OF VIX SEASONALITY BY MONTH (JAN 1990 TO AUG 2020)

Comparing average VIX Index readings on a month-by-month basis, September and October have two of the relatively highest measurements. This seasonal magnetic pull that has historically steered the VIX ‘fear-gauge’ higher and stocks lower during this time of year could potentially weigh negatively on market sentiment. On the other hand, word that the Trump administration is moving to prohibit evictions through December could help the bullish trend underpinning S&P 500 Index price action

That said, looking to the DailyFX Economic Calendar highlights the release of nonfarm payrolls as a high-impact risk event on the immediate horizon. Monthly NFP data due this coming Friday, September 04 at 13:30 GMT could weigh considerably on appetite for risk and catalyze volatility if the jobs report differs materially from forecast.
Learn More – Register to Attend the DailyFX Education Summit Online for Free!
-- Written by Rich Dvorak, Analyst for DailyFX.com
Connect with @RichDvorakFX on Twitter for real-time market insight


