


Dow Jones Price Outlook:
- The Dow Jones suffered a slight loss on Monday alongside a modest rise in volatility
- Volatility may continue to rise in the weeks ahead as seasonality shifts and the election nears
- Dow Jones Forecast: Apple Stock Split Prompts Major DJIA Changes
Dow Jones Forecast: Index Slips Ahead of Historically Bearish Month
The Dow Jones finished Monday trading just -0.78% lower than it opened as the VIX climbed modestly and the Nasdaq 100 edged slightly higher on the back of strength from stocks like Tesla. While minimal, the losses chipped away at the monthly performance of the Dow Jones which was on pace for a remarkable gain of more than 8%. Still, a 7.57% gain for the month of August – typically one of the quieter trading months – is an impressive feat given the broader market backdrop.
September Typically Sees an Increase in Volatility
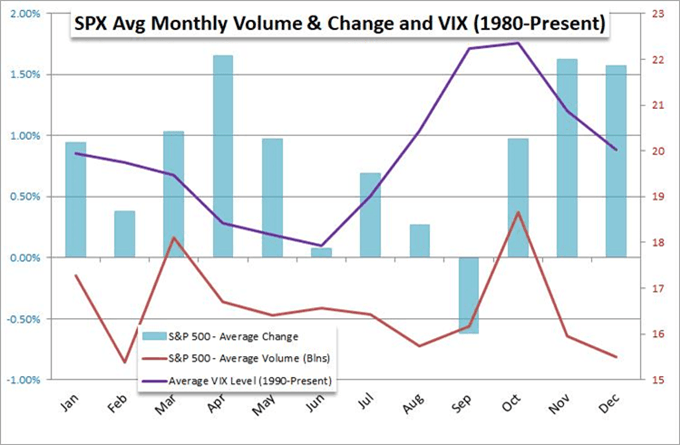
Source: John Kicklighter, Bloomberg
That said, August’s final trading day could be an early indication of a larger shift in the market as it gears up to transition from some of the calmest months to some of the most rocky. To that end, September is not only volatile, but is also the weakest month for US equities from a return perspective over the last 40 years according to history.

While past performance is not in any way indicative of future results, seasonality certainly plays a role in market activity and the looming US Presidential election could help exacerbate some of the themes established in years past.
Volatility Expected to Rise in the Weeks Ahead
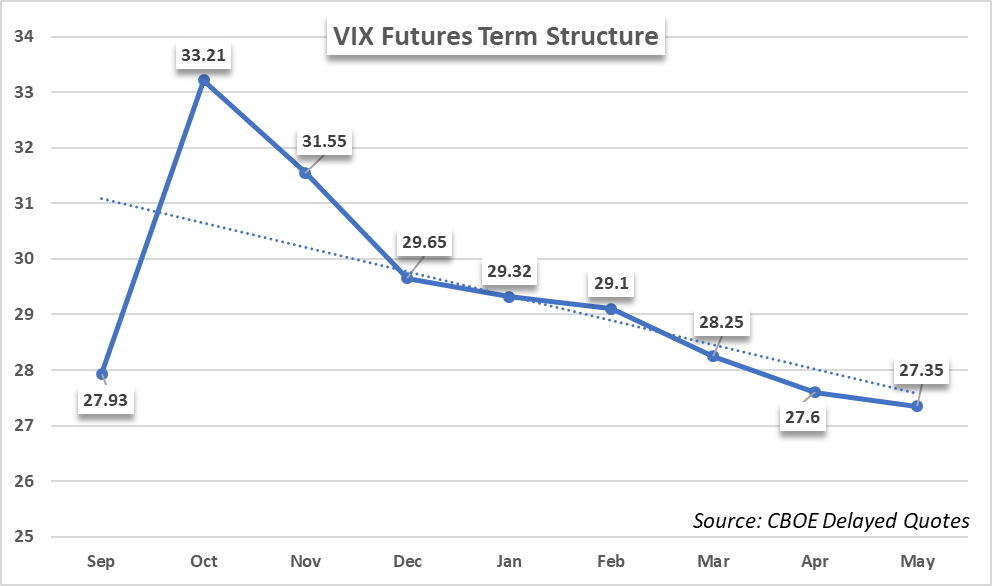
Suffice it to say, the Dow Jones, S&P 500 and Nasdaq 100 may have their work cut out for them in the coming weeks. Nevertheless, the Dow Jones has shown little indication it will suddenly reverse lower in earnest, so more consistency from bears might be required to shake the resolve of the bullish majority.
Dow Jones Price Chart: 4 – Hour Time Frame (May 2020 – August 2020)
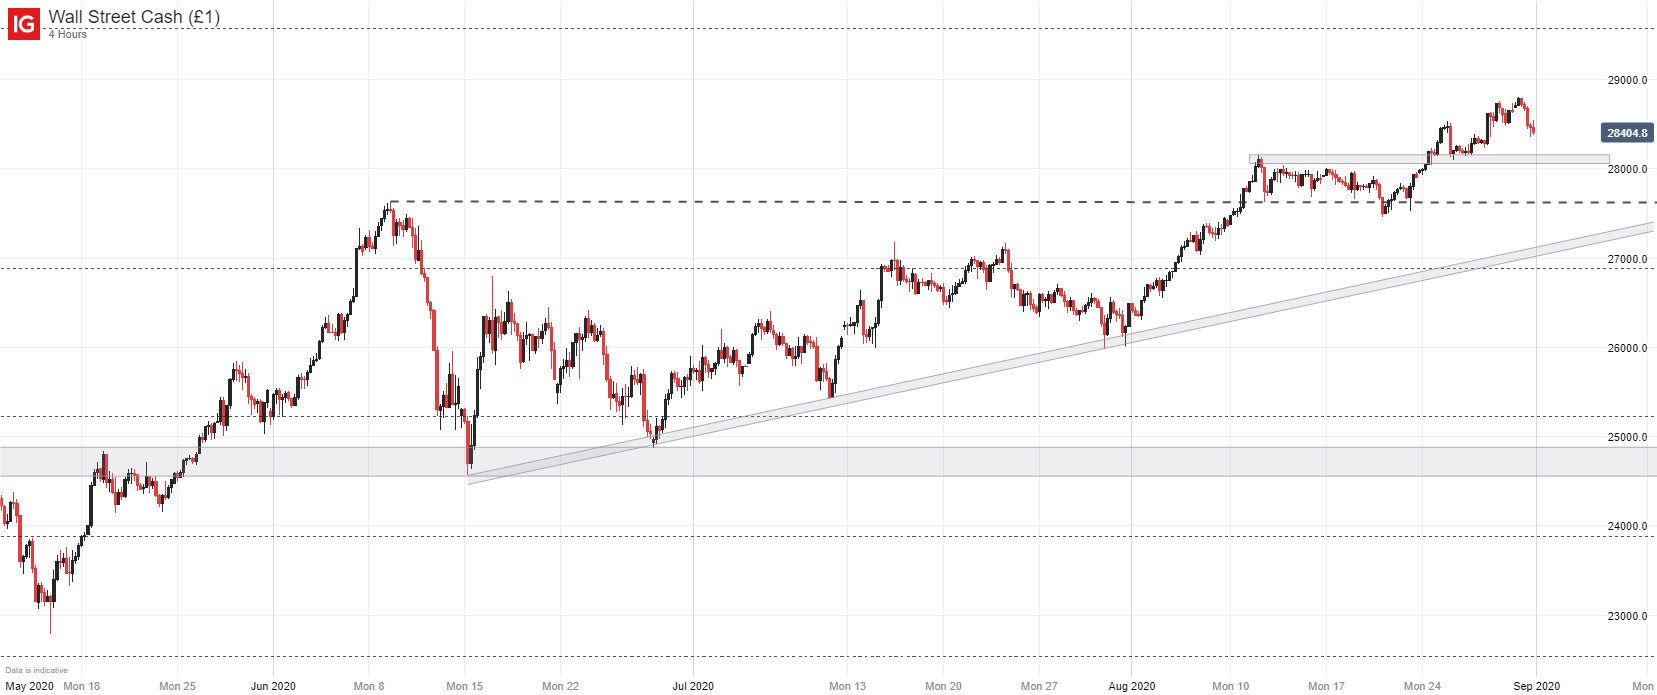
Such conviction might be established by attacking various areas of support that reside beneath the current trading price. Psychological levels, prior highs and ascending trendlines are just some of the possible areas of buoyancy beneath and bears will have to test each before a larger decline can be made. In the meantime, follow @PeterHanksFX on Twitter for updates and analysis.
--Written by Peter Hanks, Strategist for DailyFX.com
Contact and follow Peter on Twitter @PeterHanksFX


