


VIX INDEX ‘FEAR-GAUGE’ RIPS HIGHER ALONGSIDE US DOLLAR & TREASURY YIELDS AFTER FED CHAIR POWELL SPEECH AT JACKSON HOLE SYMPOSIUM
- S&P 500 VIX ‘fear-gauge’ turns sharply higher even as the stock market hits another record
- The VIX Index, US Dollar, and Treasury Yields jumped after a speech from Fed Chair Powell
- USD/JPY reversal attempt underway but bulls might struggle to take out a key technical obstacle
Federal Reserve Chair Jerome Powell likely had most market participants sitting on the edge of their seats today. The headline event of this year’s Jackson Hole Symposium was championed by Fed Chair Powell who delivered a speech on changes to the central bank’s monetary policy framework.
Specifically, the Fed announced it will start to use average inflation targeting in lieu of a symmetrical objective. Markets responded violently to the news as expected. Arguably one of the most notable reactions during Thursday’s trading session is the sharp rally staged by the VIX Index.
VIX INDEX PRICE CHART WITH US DOLLAR OVERLAID: 1-HOUR TIME FRAME (31 JUL TO 27 AUG 2020)
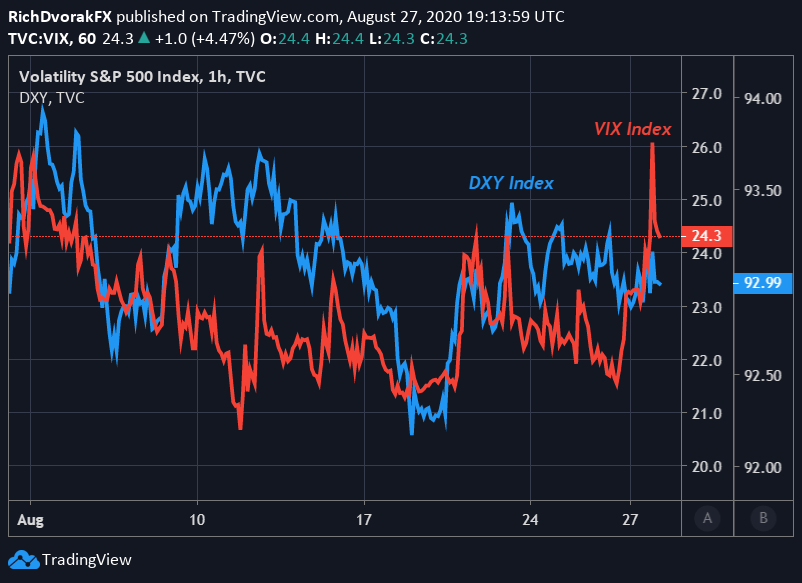
Chart created by @RichDvorakFX with TradingView
It seems that the VIX Index ‘fear-gauge’ is on the rise with investor demand for downside protection as major stock market indices, like the S&P 500 or Nasdaq, notch consecutive record highs. Month end rebalancing on deck and the possibility of hurricanes souring market sentiment could perhaps explain the spike higher in expected equity volatility as well.

Also noteworthy, further-out VIX Index futures contracts, such as the October VIX and November VIX, are trading considerably higher than the front-month VIX. This creates potential for convergence, which stands out as a threat that might undermine the relentless risk rally helping send stocks to all-time highs. At the same time, in consideration of its posturing as a top safe-haven currency, the broader US Dollar likely stands to move in tandem with the VIX Index.
USD/JPY PRICE CHART: DAILY TIME FRAME (25 MAY TO 27 AUG 2020)
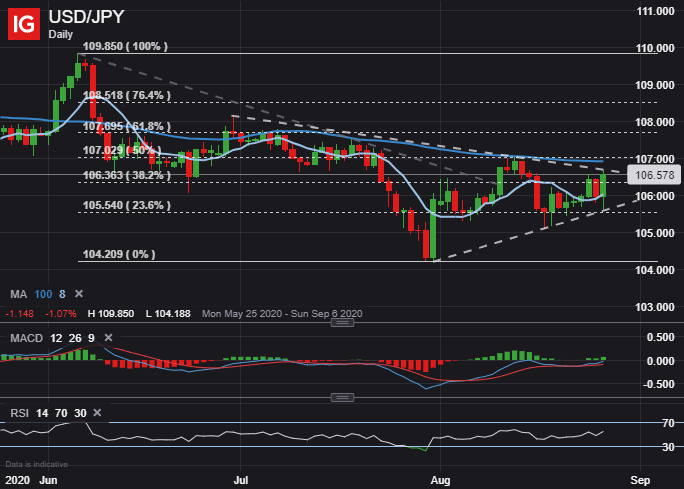
US Dollar strength on Thursday was mostly reflected by spot USD/JPY price action. The Dollar-Yen is now trading comfortably above its 8-day moving average thanks to a bullish engulfing candle just printed by the major FX pair. USD/JPY upward momentum has also gained pace over the prior three sessions as indicated by the MACD. Meanwhile, the relative strength index is pointing higher as the broader US Dollar attempts to build a base and rebound off two-year lows. With the 38.2% Fibonacci retracement level of June to July’s bearish leg in the rearview, this zone of technical confluence might provide some support to spot prices going forward.

Clearing the 100-day moving average could be difficult for USD/JPY bulls to surmount, however, with the 107.00-level standing out as an area of technical resistance that could stymie a strengthening Dollar. That said, the broader trend of USD/JPY price action looks clouded overall. This is due to the Dollar-Yen coiling like a tightly wound spring between lower highs on 30 June and 13 August while forming a string of consecutive higher lows since 31 July.
USD/JPY PRICE CHART WITH TEN-YEAR TREASURY YIELD OVERLAID: 4-HOUR TIME FRAME (28 MAY TO 27 AUG 2020)
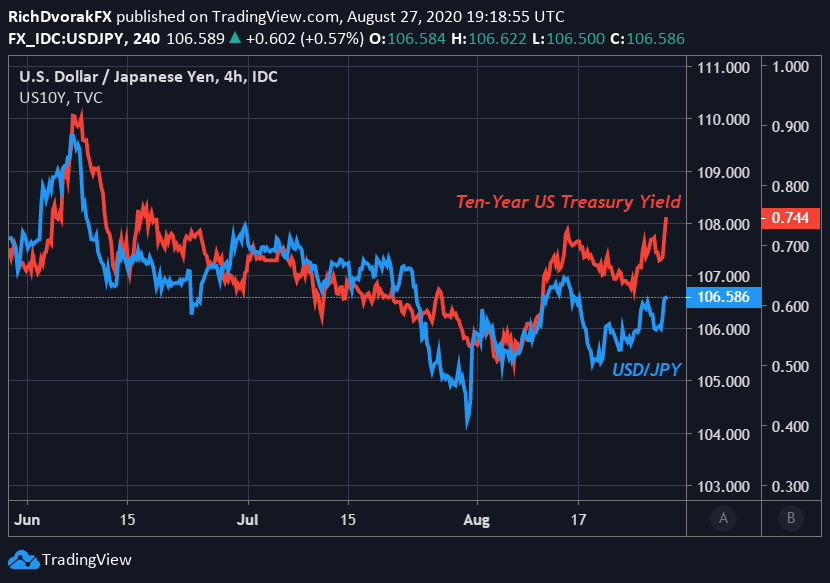
Chart created by @RichDvorakFX with TradingView
In light of overall mixed technical readings, the direction of US Treasury Yields could serve as a possible bellwether to where the Dollar-Yen heads next. Spot USD/JPY price action tends to hold a strong direct relationship with Ten-Year Treasury Yields as indicated in the chart above.
| Change in | Longs | Shorts | OI |
| Daily | -2% | 2% | 0% |
| Weekly | 12% | -16% | -6% |
Further, the latest IG Client Sentiment readings could shed light on where USD/JPY might be headed as well. I discuss using the IG Client Sentiment Report as a trading tool and cover additional details for USD/JPY price outlook in the webinar video archived along with this analysis.
Keep Reading – US Dollar Price Action: USD Bears Whiplashed by Dollar Reversal
-- Written by Rich Dvorak, Analyst for DailyFX.com
Connect with @RichDvorakFX on Twitter for real-time market insight


