


US Dollar Price Forecast:
- It’s Day One of the Jackson Hole Economic Symposium and risk markets opened the event with a wild ride.
- FOMC Chair Jerome Powell announced a potentially major shift in the bank’s strategy by stating that they’ll be prioritizing employment while targeting ‘average inflation,’ seemingly opening up to inflation overshoots should they show in the data.
- While such news would often be considered USD-negative, US Dollar bears were soundly crushed this morning when an initial breakdown was aggressively snapped back. This highlights the potential for the theme discussed earlier this week, asking whether US Dollar bears have capitulated after an aggressive down-trend in the past few months.
- This article incorporates price action to help spot that potential for capitulation. To learn more about price action, check out our DailyFX Education section.
Jackson Hole Opens with Volatility
Well, its 2020 and Day One of Jackson Hole has so far not disappointed, staying on theme with the craziness that has become this year. The Fed announced a potentially major change this morning when Chair Powell announced a strategy shift at the bank.
While the Fed has been one of the notable Central Banks employing a dual mandate, targeting both inflation and employment, more recently we’ve seen the bank’s grasp expand to include items like income inequality and even global warming. But today they announced what appears to be a prioritization in the dual mandate that they’re charged to defend, by announcing that they’ll be focusing more on the employment side of their directive while being more flexible with inflation.
While the Fed previously targeted 2% inflation, this morning they announced that they’re now looking for 2% inflation ‘on average.’ This means the bank will likely be a bit more forgiving with inflation overshoots and judging by last month’s inflation data, there’s a reason that they’re employing this shift as the troves of stimulus launched in the last six months may, in fact, create some pretty aggressive inflation. And given that employment numbers remain poor, the bank didn’t want to be put into a spot where they had to hike rates in a weak economy just for the simple reason of controlling price pressures.
The immediate response to this announcement was bullish breakouts in Gold, Silver, Stocks as the USD dipped down for a quick support test. But that didn’t last for long, as we’ll touch on after the next couple of charts.
Gold 15 Minute Price Chart: Breakout, Snap Back On Powell Comments

Chart prepared by James Stanley; Gold on Tradingview
Taking a step back on Gold, and that false breakout speaks volumes about this morning’s price action, and from there some deduction can help lead into some strategy ideas.

As looked at earlier this week, the bigger picture bullish trend in Gold remains on pause as price action grinds around a key support area on the chart. This is the same support zone looked at earlier in August, just after prices had set a fresh all-time-high. But, as also noted in that article, a bearish engfulfing candlestick showed up, opening the door for a pullback and that’s what helped to drive prices down to support in the first place. But, over the past few weeks, this zone from around the prior high of 1920 up to the 1941 level has helped to hold the lows.
This morning saw a quick breach of a bearish trendline connecting lower highs of the past couple of weeks, but that breakout could not hold as buyers quickly pulled back and price action sank to support.
Gold Four-Hour Price Chart
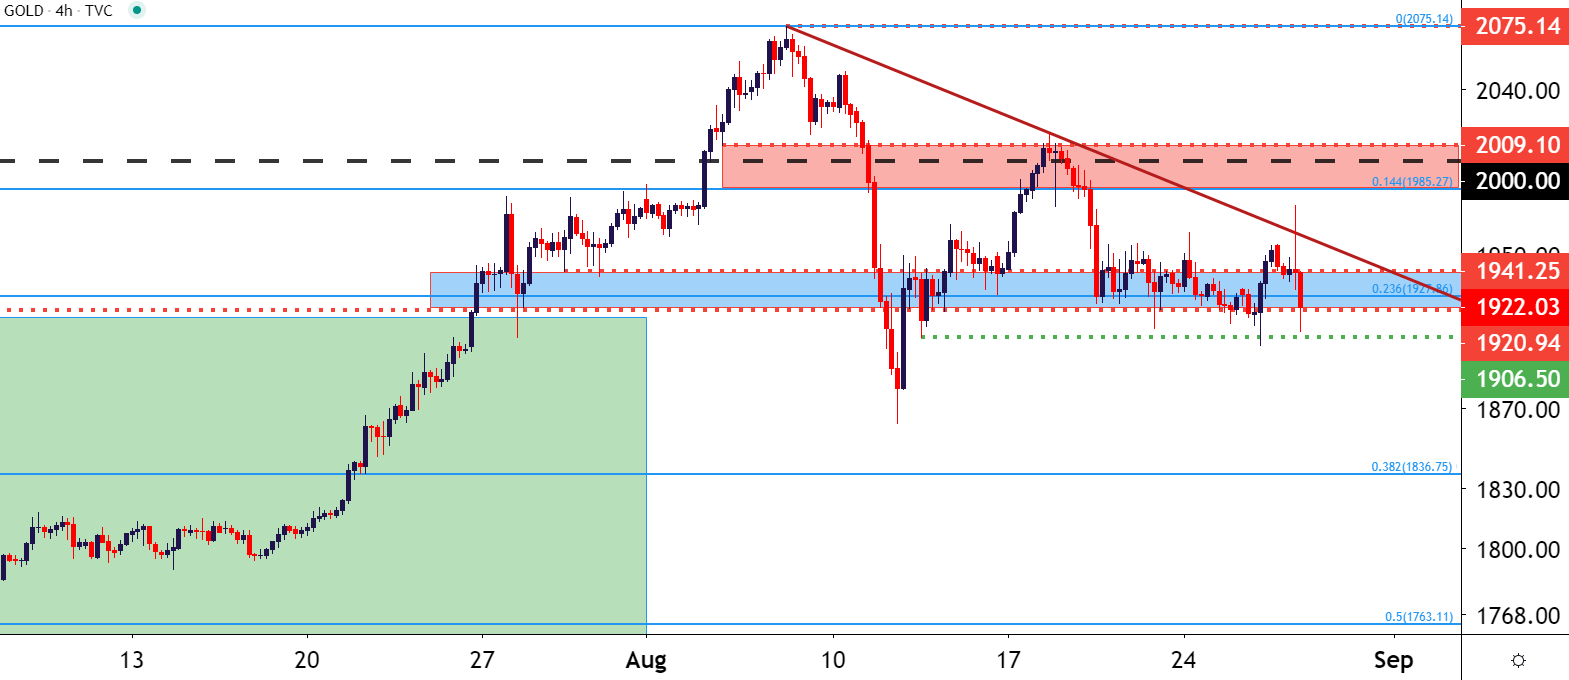
Chart prepared by James Stanley; Gold on Tradingview
Perhaps the Key to This Morning’s Whipsaw?
At the core of many of this morning’s reversals is a similar theme in the US Dollar, and this is something we’ve been following for the past few days as there’ve been increasing signals of potential capitulation.

Last week saw USD bears probe down to a fresh two-year-low, but they couldn’t hold the move nor could they break any fresh ground. The current down-trend has been in force for most of Q3, with an aggressively bearish move driving through July and price action beginning to exhibit tendencies of range so far in August.
But last week’s failed breakdown exposed a wick underneath recent support – and just below current price action is a potentially key zone of confluence on the US Dollar around the 92-handle. This could be a case of USD bears showing trepidation after an extended downside run has pushed USD price action near a critical support zone.
Also of interest on that theme and something we discussed on Tuesday – there aren’t many other major currencies that actually look attractive for strength right now – and if the USD is going to keep dropping – some other major currencies are going to need to pick up the slack. Will that be the Euro or the British Pound? Or perhaps the Japanese Yen?

At this point the US Dollar remains in a spot that could be open for reversals. On the weekly chart below, we can see four of the past five weeks have shown reactions around the 92.55 level – highlighting the continued build of support around this price despite the seemingly negative backdrop on the currency.
US Dollar Weekly Price Chart

Chart prepared by James Stanley; USD, DXY on Tradingview
And taking a step back to the Monthly chart, we can get a better idea of what bears might be shying away from, as there are multiple reasons for buyers to jump in at each of the support items just below current price. A trendline connecting 2011 and 2014 lows is confluent with two different Fibonacci levels around the 92-handle.
US Dollar Monthly Price Chart

Chart prepared by James Stanley; USD, DXY on Tradingview
--- Written by James Stanley, Strategist for DailyFX.com
Contact and follow James on Twitter: @JStanleyFX


