


Silver Price Analysis:
- Fibonacci holds bulls at bay at key level of support
- Short-term price action falls below 100 on CCI, while remaining above the 55 period EMA
- Will the release of key economic data be enough for buyers to maintain the trend?
XAG/USD Confined to Key Fibonacci Levels
An increase in rhetoric around the US-China trade wars, stimulus uncertainty and growing concerns related to the coronavirus pandemic have not only contributed towards a weaker US Dollar, they have also once again confirmed the appeal for Gold, Silver and other safe-haven assets.
The monthly chart below highlights Fibonacci levels from three major moves. The first Fibonacci retracement (pink) represents the major move between the September 2008 and the March 2011. The second Fibonacci (blue) represents the medium-term move, plotted between the March 2011 high and the March 2020 low, while the third Fibonacci (purple), is the short-term move, taken from the March 2020 low to the July 2020 high.
Silver Monthly Chart
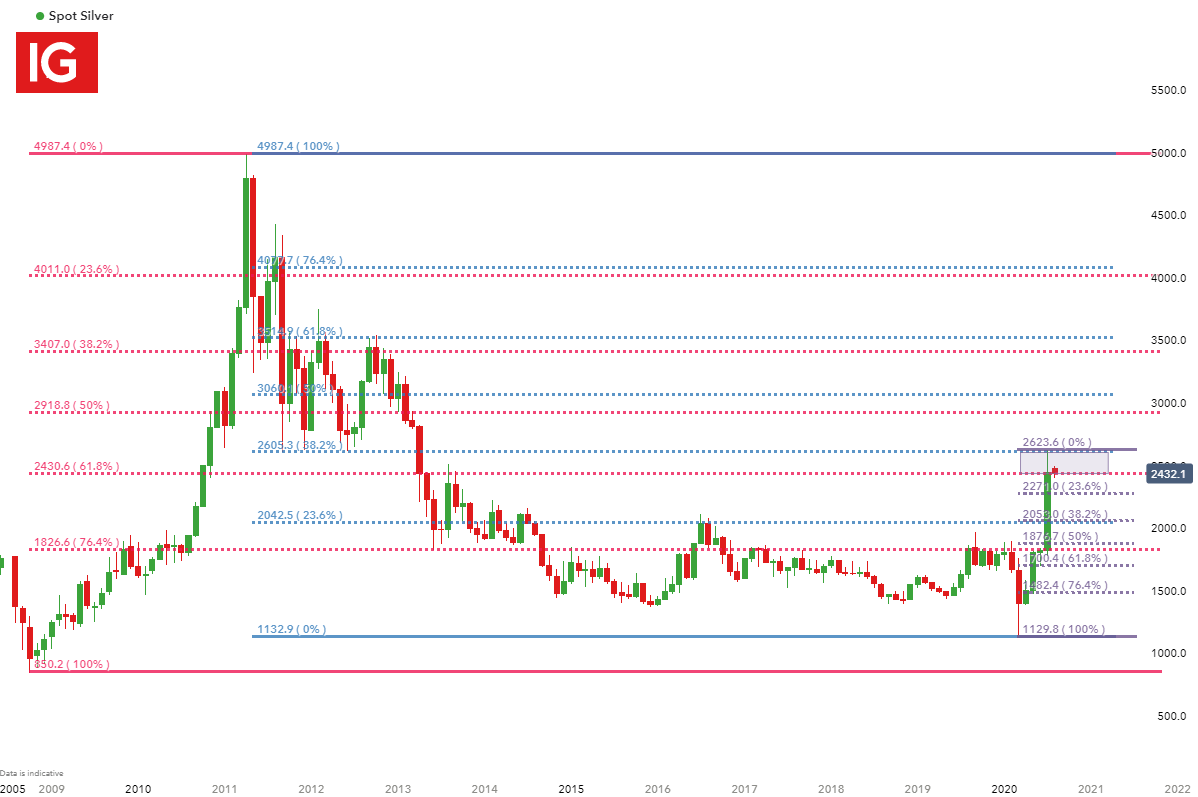
Chart Prepared by Tammy Da Costa, IG
After recovering from March lows, a strong bullish trend has been present, with the price of silver increasing by approximately 25% until reaching 2600 on 28 July. However, last week, prices have been trading within confluent zones, formed by the Fibonacci levels from the retracements mentioned above.
CCI Drops Below 100
Meanwhile, from a shorter-term perspective, the Commodity Channel Index (CCI), a technical indicator used to measure the price of an asset in relation to its recent average, has fallen below 100 as indicated on the four-hour chart below, a possible indication that upward momentum may be slowing, with price action starting to show a penchant for mean reversion.
Silver 4-Hour Chart

Chart Prepared by Tammy Da Costa, IG
Moving Forward
While economic uncertainty remains, the release of key economic data this week may drive price action in either direction.
If prices break above the current spot of support at 2430.6, the 61.8% retracement of the major move; bulls may focus on an extension of the move, towards the physiological level of 2500 and possibly a push towards 2605, the 38.2% Fibonacci level of the secondary move.
Contrary to this, a break below may see Silver falling towards 2270.3 which is confluent with the 38.2% retracement level of the short-term move looked at above.
Client Sentiment

According to client sentiment, at the time of writing, majority of retail traders are showing a bullish bias towards Silver, with 86% of traders holding long positions. We typically take a contrarian view to crowd sentiment, and the fact traders are net-long suggests that prices may fall amid signs of a stronger US Dollar.
--- Written by Tammy DaCosta, Market Writer for DailyFX.com
Contact and follow Tammy on Twitter: @Tams707


