In the DailyFX Trading Course, we teach traders that when the market is in a downtrend, we should look for rallies up off of the lows to a resistance level as a selling opportunity. However, at times there does not seem to be any visible resistance on the chart to offer that opportunity.
This is one situation where the use of Fibonacci retracement levels can offer potential resistance levels.
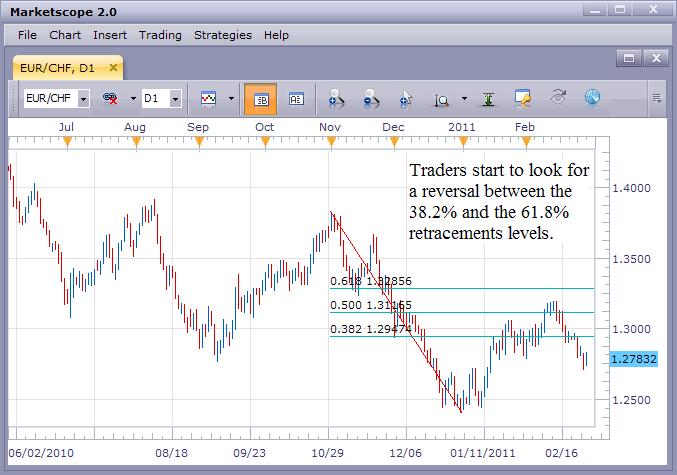
The key is to first identify the direction of the trend and then to wait for that move against the trend. The use of Fibonacci retracement levels offer three popular levels of potential support in an uptrend and three levels of resistance in a downtrend and they are the 38.2%, the 50% and the 61.8% levels. An example would be if the market moved down 1000 pips and then started to rally off of the lows, a 38.2% rally would be 382 pips of that 1000 pip move, a 50% rally would be 500 pips, while the 61.8% rally would be 618 pips off of the low. Many traders will look for sells at the 50% or 61.8% retracement levels and place their protective stop beyond the 61.8% level. Others may use a technical indicator to help better time their entry and there are many examples in the DailyFX Trading Course to show how this is done. The rally up to between the 38.2% and 61.8% levels signals the trade zone. Traders would then use another method to identify the actual sell entry into the trade. We only look for sells since the trend is down, we wait for a rally up to resistance to note a potential trade and then we can use a technical indicator to help us time our entry.
If this looks simple, it is because it is meant to be simple. The difficult part is waiting for these solid setups to form and then to be there to take advantage of them. But knowing what to look for is the first step to trading them.