Crude Oil Price, Chart and Outlook.
- Oil moves gently higher as volatility remains subdued.
- A meeting of two moving averages may spark the next move.


Oil – Looking to Fill the Gap
In last week’s weekly oil forecast, I noted that any sell-off in the oil space would likely to be short-lived and
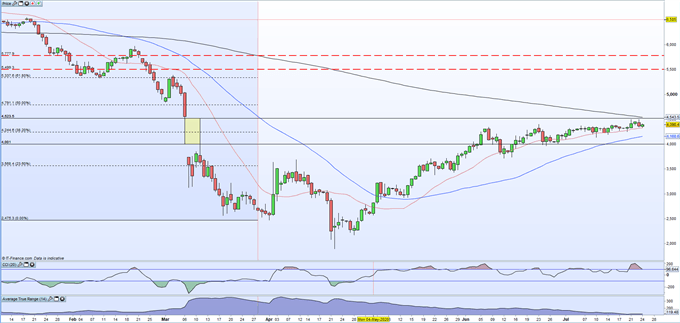
‘the path of least resistance for oil is set to be a slow grind higher’ and this remains the case. The price of Brent has nudged higher over the week with little in the way of any macro-news to either accelerate the trend or cause it to change direction. The chart set-up now becomes more interesting as oil tries to fill the gap on the daily chart from the March 6 low at $45.23/bbl. Brent has tried and failed twice to breach this level this week and a third attempt looks likely very soon.
WTI vs Brent: Top Five Differences Between WTI and Brent
Brent is finding support from the upward sloping 20-day moving average, an indicator that is has respected since early May. While the spot price has dipped this indicator on a few occasions since then, there has been no clear break or open below this line, adding to its supportive credibility. Another moving average, the 200-dma, now lies in wait, currently at $45.40/bbl. and just above the March 6 low print. It remains to be seen which moving average holds sway and the next few days may see price action squeezed further, especially with volatility, measured by the Average Trading Range (ATR) at a multi-month low.
Introduction to Technical Analysis
Brent Crude Oil Daily Price Chart (January – July 24, 2020)

| Change in | Longs | Shorts | OI |
| Daily | -7% | 9% | -2% |
| Weekly | -8% | 15% | -1% |
Traders may be interested in two of our trading guides – Traits of Successful Traders and Top Trading Lessons – while technical analysts may be interested in our latest Elliott Wave Guide.
What is your view on Crude Oil – bullish or bearish?? You can let us know via the form at the end of this piece or via Twitter @nickcawley1.


