


Crude oil filled the ‘Saudi gap’ yesterday, also coming very close the lows from June 2017 and December 2018. Given the extended nature of oil and resistance we could see it turn down from here. The price of oil has been kept in an orderly advance after a very disorderly March and April. The upward trend has taken on the shape of a channel, and while not the most structurally sound it does keep the rise intact for the moment. A break below the lower trend-line should help usher in some momentum. However, we may need to see the risk trade come apart (stocks drop) for oil to really begin rolling lower. The first real level of sizable support, when looking at the August contract, is around 34.60.

Crude Oil Daily Chart (Saudi gap filled, channel structure)
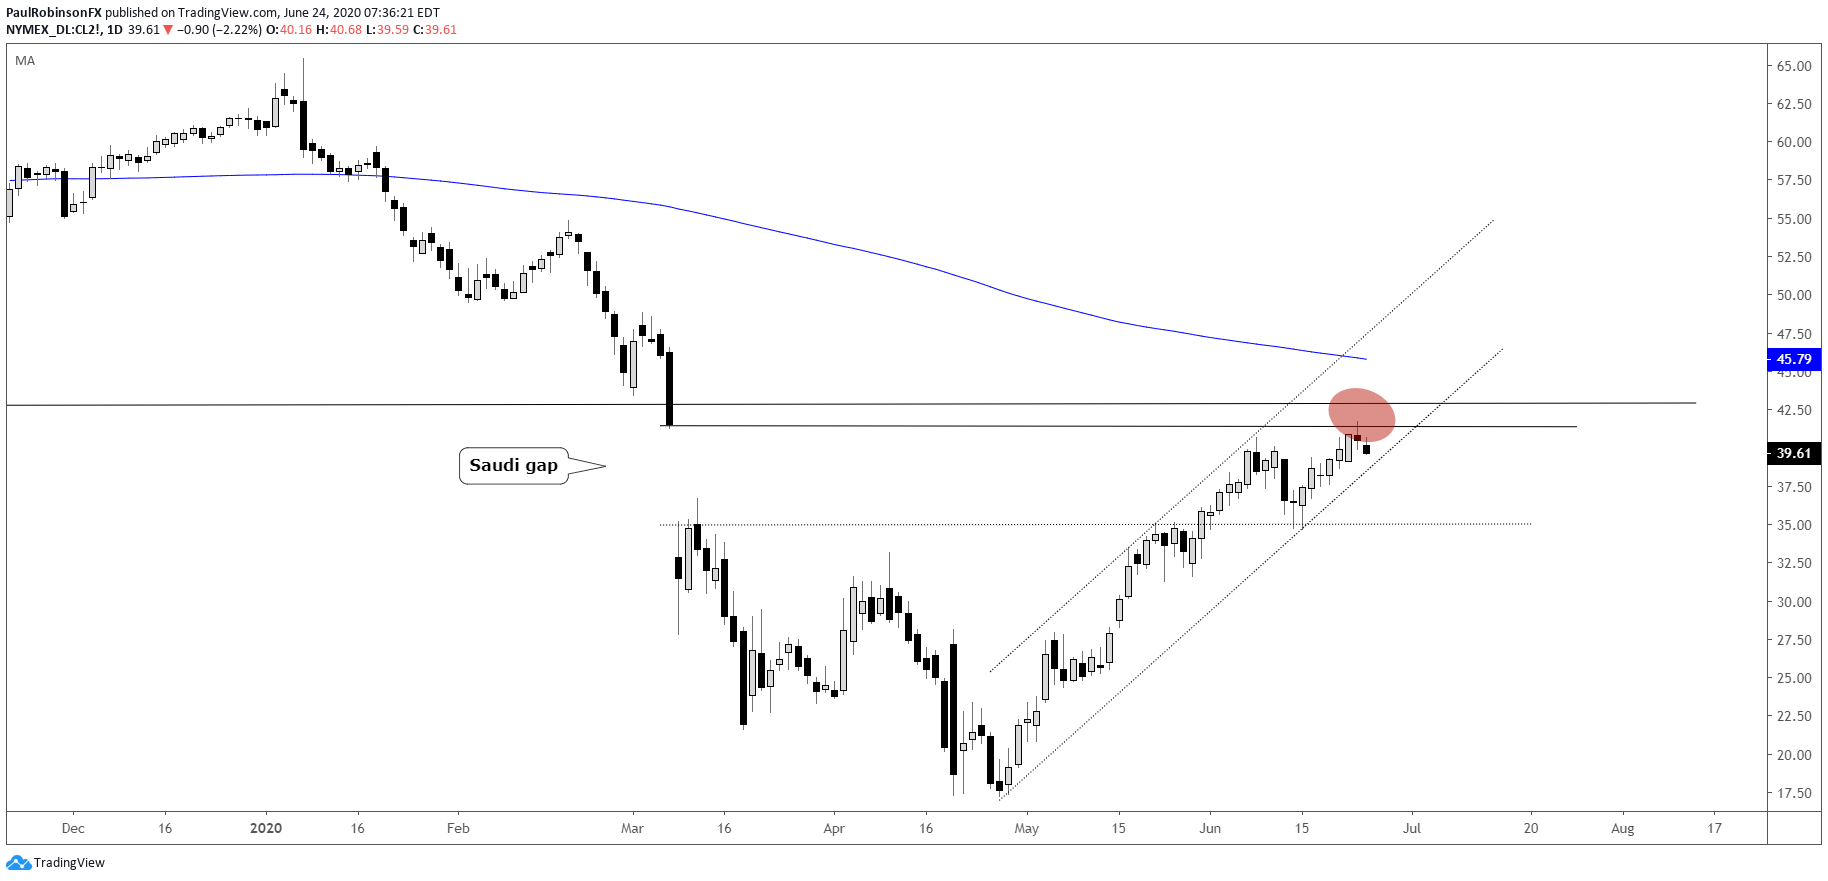
Crude Oil Chart by TradingView
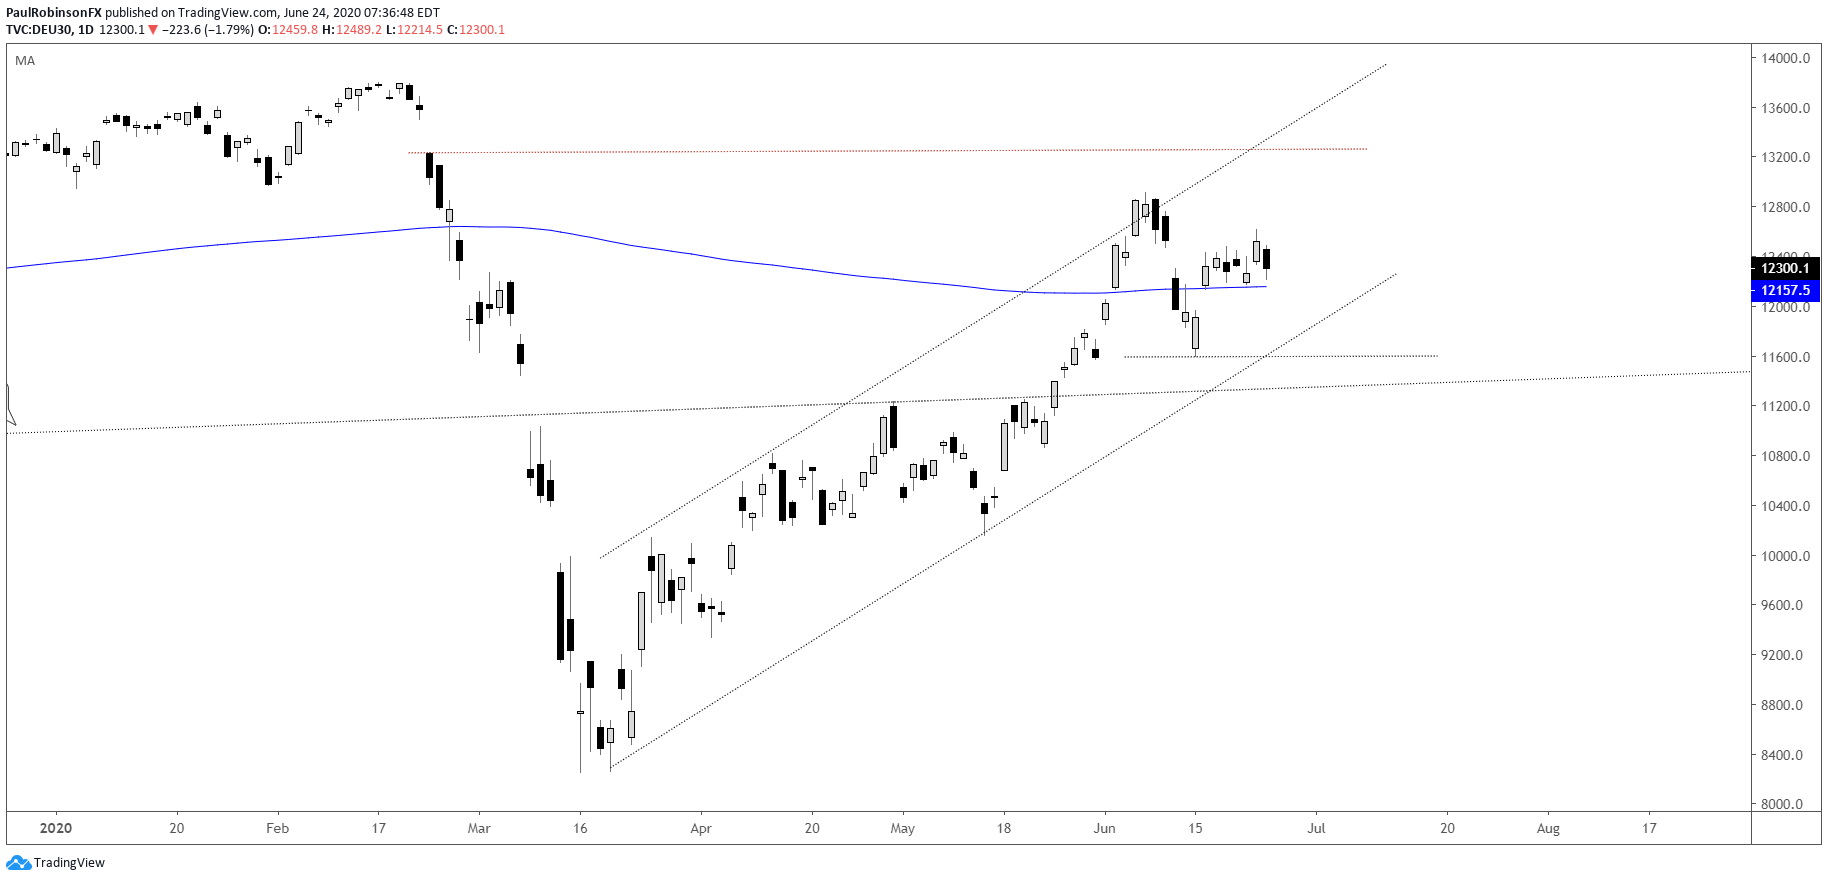
The DAX is trying to work its way higher after the earlier-month shellacking, but it could result in a lower-high if it can’t get into gear soon. A lower-high doesn’t necessarily mean it will roll over, but it will be the first sign that we may see a trend lower develop. For the downside to gain traction we want to see the lower parallel of the rising channel off the March low get snapped. This would also require a breakdown below the 11597 level to get a lower-low in the sequence. In the near-term the 200-day is acting as support at 12157, so continue to watch and see if that can be a factor as the DAX attempts to avoid the lower-high scenario.
DAX Daily Chart (lower-high potential, still in channel)
Silver remains in an upward trend off the March low, trying to break out of a bull-flag pattern after holding onto the trend-line above the 200-day. A break above the trend-line from September and 18.38 should have silver on a roll higher. Keep an eye on gold as it has broken out of a two-month trading range.
Silver Daily Chart (trying to break out)
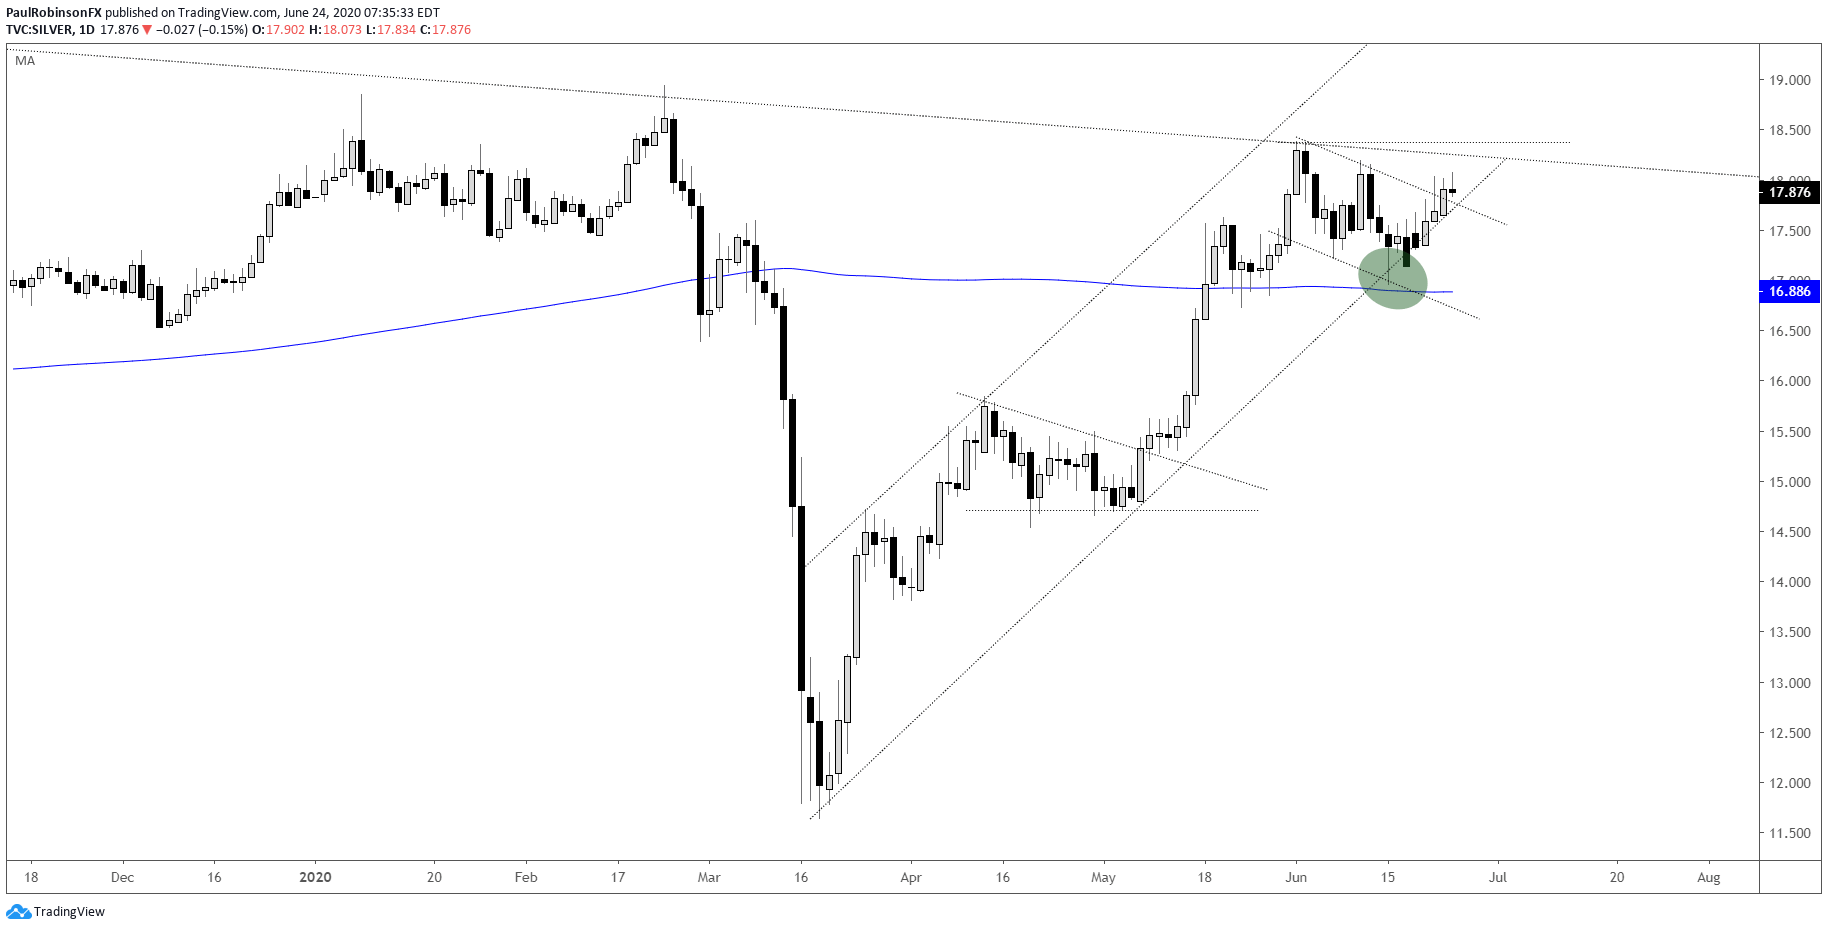
Silver Price Chart by TradingView
To see all the charts we looked at, check out the video above…
Resources for Index & Commodity Traders
Whether you are a new or an experienced trader, DailyFX has several resources available to help you; indicator for tracking trader sentiment, quarterly trading forecasts, analytical and educational webinars held daily, and trading guides to help you improve trading performance.
We also have a series of guides for those looking to trade specific markets, such as the S&P 500, Dow, DAX, gold, silver, crude oil, and copper.
---Written by Paul Robinson, Market Analyst
You can follow Paul on Twitter at @PaulRobinsonFX


