


Eurozone GDP and EUR/USD Price, News and Analysis:

Euro-Zone Q1 GDP Beats Expectations, German Exports Crater
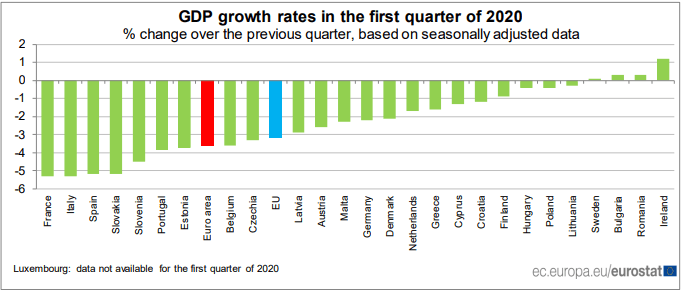
Euro-Zone Q1 GDP came in slightly better-than-expected earlier today at -3.6% q/q compared to earlier forecasts of -3.8%. According to Eurostat,among Member States for which data are available for the first quarter of 2020, Ireland (+1.2%), Bulgaria and Romania (both +0.3%) as well as Sweden (+0.1%) still recorded postitive growth compared with the previous quarter, while GDP fell in all other EU Member states, with the highest declines in France and Italy (both -5.3%) as well as Spain and Slovakia (both -5.2%).
Earlier in the session, data from the Federal Statistics Office, Destatis, showed German exports and imports slumping in April, missing already pessimistic expectations. Exports were down 24% on the previous month and 31.1% lower on the same month a year earlier, while imports fell 16.5% and 21.6% respectively. The export decline compared to April 2019 was the largest fall since the introduction of foreign trade statistics in 1950.
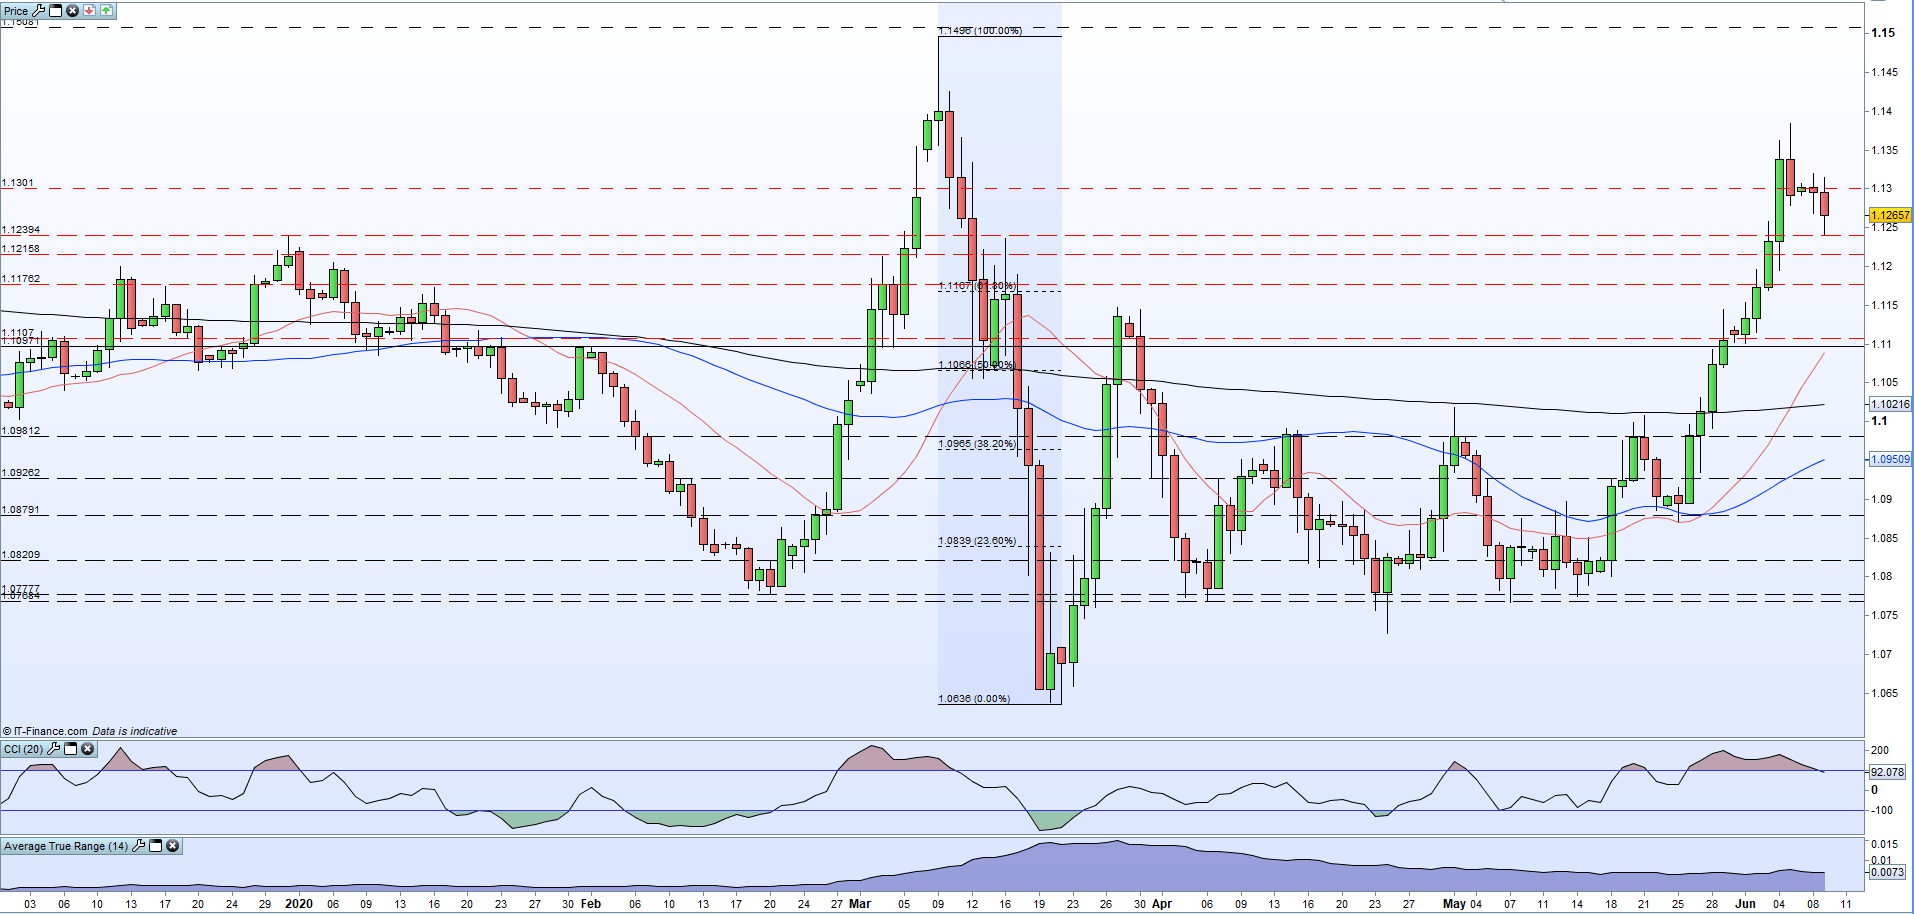
The single currency remains weak against the US dollar and slipped below 1.1250 in early trade. The greenback is starting to pick up a bid after its recent heavy falls as traders wait for the main event of the week, the FOMC meeting on Wednesday. Expectations are starting to build that Fed chair Jerome Powell may signal that the US economy is starting to turn around, especially after last Friday’s US jobs report, and if this is the case, the greenback will likely pick up a further bid. The recent EURUSD slide has seen the pair print three successive lower highs and lower lows – disregarding the Sunday candle – leaving 1.1200 vulnerable ahead of the 61.8% Fibonacci retracement at 1.1107. The 14-day ATR remains steady around 73 pips while the CCI indicator has moved out of overbought territory.
EUR/USD Daily Price Chart (December 2019 – June 9, 2020)
| Change in | Longs | Shorts | OI |
| Daily | -1% | -4% | -3% |
| Weekly | 4% | -10% | -5% |
What is your view on EUR/USD – bullish or bearish?? You can let us know via the form at the end of this piece or you can contact the author via Twitter @nickcawley1.


