


Dow Jones, S&P 500, Nasdaq 100 Price Analysis & News
- Dow Jones | Bottom is Far from Being Reached
- S&P 500 | At an Inflection Point
- Nasdaq 100 | Support at Risk of Failing and Sentiment Deteriorates
Global equity markets are in freefall, despite the central banks best efforts to stem the panic selling. The Federal Reserve announced a 100bps reduction in the target range to 0-0.25%, alongside a $700bln QE program. Elsewhere, the RBNZ cut interest rates to the effective lower bound of 0.25% (prev. 1%), while the Bank of Japan doubled its ETF purchase pace. However, this is unlikely to address the underlying issue centered around the spread of the coronavirus which has forced several countries across the globe into lockdown. Therefore, as the recession becomes seemingly unavoidable, equity markets will continue to reprice lower.
US Recession Watch - Panic When the US Curve Steepens
How to Invest During a Recession: Investments & Strategy

Dow Jones | Bottom is Far from Being Reached
US equity futures have dived, hitting limit down as the Federal Reserve fails to calm market fears. The Dow Jones is expected to open with heavy losses and therefore take out the rising trendline stemming from the financial crisis low. With little in the way of notable support, the bottom is far from being reached.
Dow Jones Price Chart: Weekly Time Frame

Source: IG Charts
S&P 500 | At an Inflection Point
Throughout the multi-year bull trend, corrections in the S&P 500 have ultimately managed to find support from the 200WMA (2642). However, with SPY futures indicating heavy losses for the index, there is a heightened risk of a firm break below support, which in turn leaves the index vulnerable to an extended move towards 2315.
S&P 500 Price Chart: Weekly Time Frame
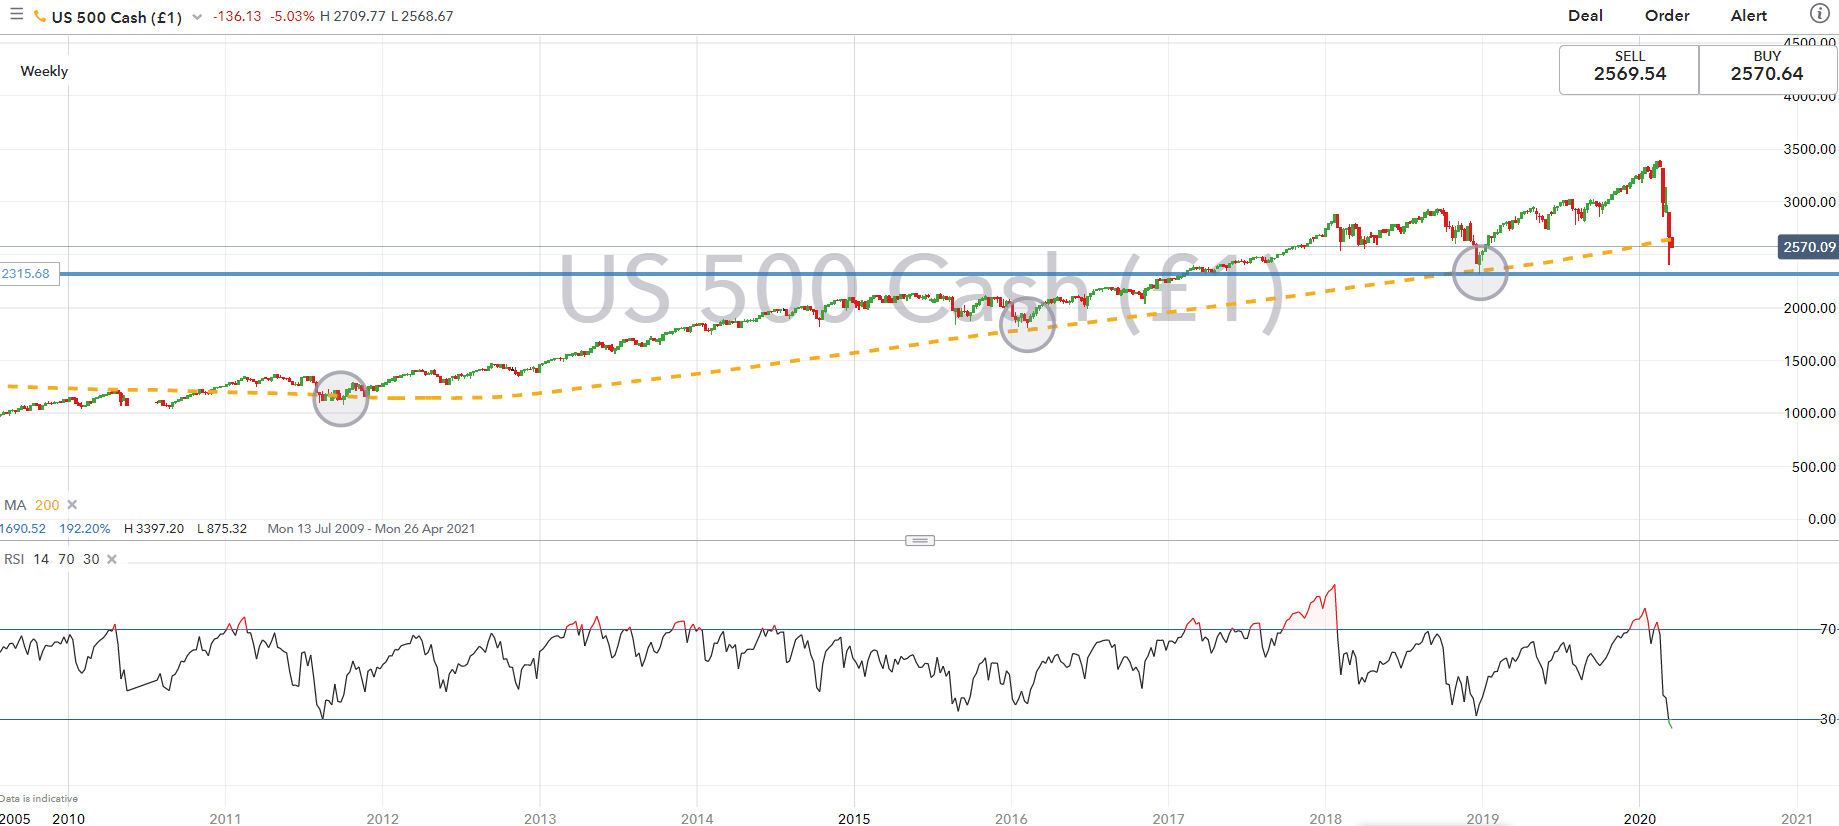
Source: IG Charts
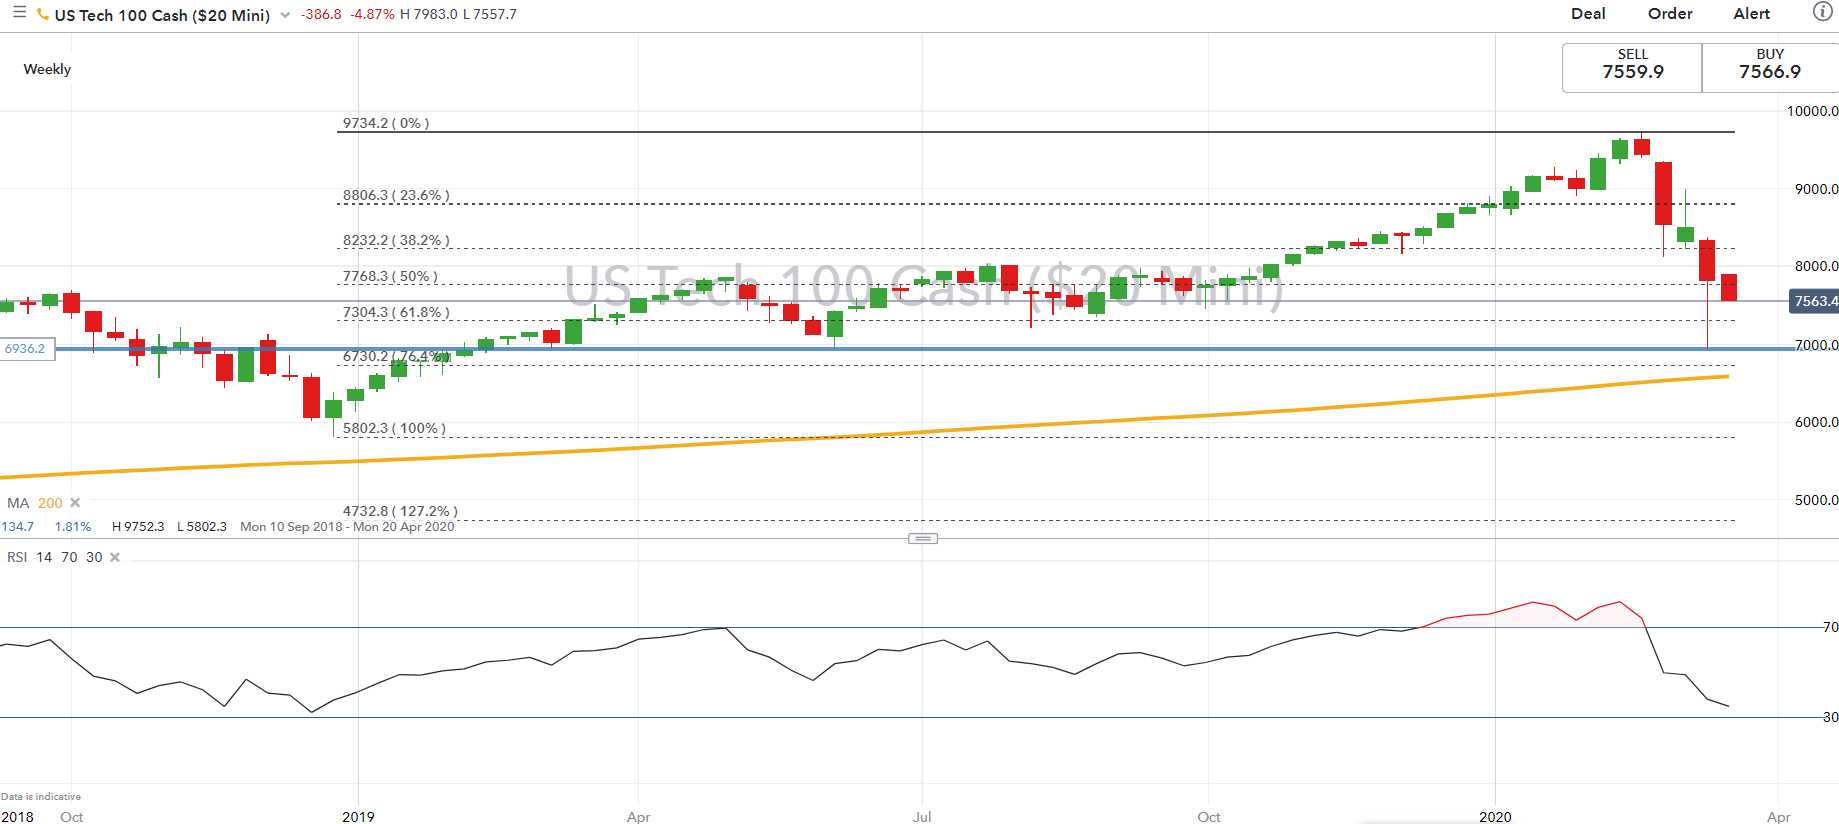
Nasdaq 100 | Support at Risk of Failing and Sentiment Deteriorates
The Nasdaq 100 is on course for another leg lower, which raises our attention to potential support situated at 7304, marking the 61.8% Fibonacci retracement from the 2018-2020 rise. However, as the deterioration shows little signs of abating, risks remain for a move towards an eventual test of the psychological 7000 level.
Nasdaq 100 Price Chart: Weekly Time Frame
--- Written by Justin McQueen, Market Analyst
Follow Justin on Twitter @JMcQueenFX


