DAX 30 Price Outlook:
- The DAX 30 is encountering resistance as it attempts to recover from steep declines last week
- Gains for the German index may lag that of the Dow Jones and Nasdaq following a surprise rate cut
- Either way, history suggests stock volatility may continue in the weeks ahead
DAX 30 Price Forecast: Resistance Stands in the Way of Recovery
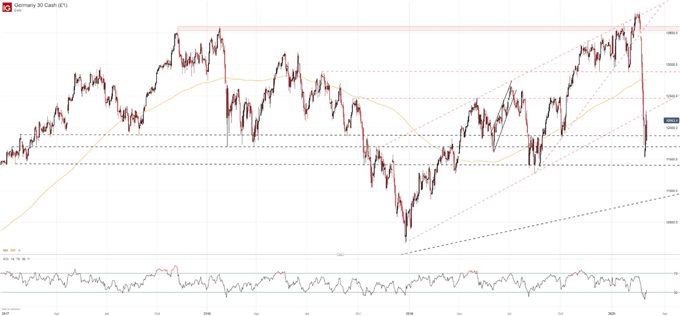
The DAX 30 has unleashed a recovery attempt after falling precipitously from all-time highs over the last two weeks. As a result, the German equity index has moved to test resistance in the form of a rising trendline from December 2018. While the Dow Jones, S&P 500 and Nasdaq have had the benefit of a 50-basis point rate cut from the Fed, the ECB has fewer options at hand which could see the DAX lag its American counterparts regardless of overhead resistance.
DAX 30 Price Chart: Daily Time Frame (January 2017 – March 2020)

Either way, the rising trendline around 12,260 will be an early test of the DAX’s newfound bullishness. A break above would be an encouraging development that could allow the index to test subsequent resistance around 12,500 ahead of the 200-day simple moving average at 12,740.
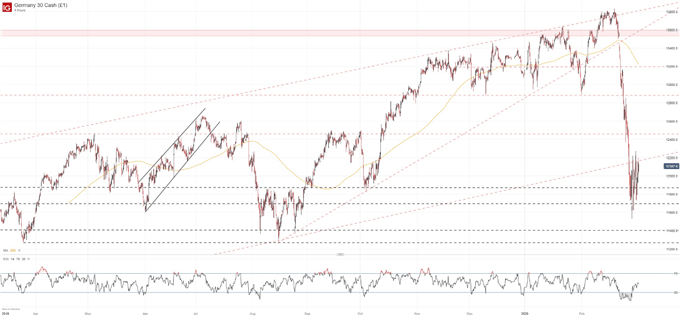
DAX 30 Price Chart: 4 – Hour Time Frame (March 2019 – March 2020)

Potential support in the event risk aversion returns should reside around 11,873, 11,688 and, perhaps most importantly, 11,525 which coincides with the recent swing low. A successful break beneath the level would establish a lower-low and may see the DAX 30 continue lower still.
| Change in | Longs | Shorts | OI |
| Daily | -1% | -7% | -6% |
| Weekly | -24% | 1% | -7% |
That being said, IG Client Sentiment Data reveals retail traders are once again net-short the DAX – a sign bulls may prevail in the weeks ahead. Similarly, RSI has crept out of oversold territory but only slightly. Thus, the DAX should have a lot of room to run should the fundamental landscape allow.
To that end, European officials may look to offer a lifeline in the form of fiscal reform which could spark further bullishness. In the meantime, follow @PeterHanksFX on Twitter for updates and analysis on the stock market.
--Written by Peter Hanks, Junior Analyst for DailyFX.com
Contact and follow Peter on Twitter @PeterHanksFX


