


S&P 500, US DOLLAR EDGE LOWER AS TREASURY YIELD CURVE INVERSION SUGGESTS RECESSION RISK LINGERS
- The S&P 500 Index has slid over 2.25% from its all-time high of 3,334 printed on January 22 as volatility returns and risk appetite wanes
- Bond traders remain skeptical of the recent rally in equities judging by the Treasury yield curve spread which has inverted again for the first time since mid-October
- USD/JPY could drop further with the US Dollar weakening against the Japanese Yen amid lingering recession fears signaled by the Treasury yield curve
Markets may want to take notice of the US Treasury yield curve seeing that it has just inverted along the 10-year and three-month maturities once again. An inverted yield curve has historically served as a strong barometer to gauge recession probabilities, which may prove its use as a bellwether to the next economic downturn once.
Global central banks have rushed to shore up slowing GDP growth by slashing benchmark interest rates and boosting liquidity in hopes of extending the longest business cycle in history, but bond traders seem to be questioning whether the recent tsunami of monetary stimulus is enough to prevent an end to this bull market.
CHART OF US YIELD CURVE SPREAD: 3-MONTH, 2-YEAR, 5-YEAR & 10-YEAR TREASURIES
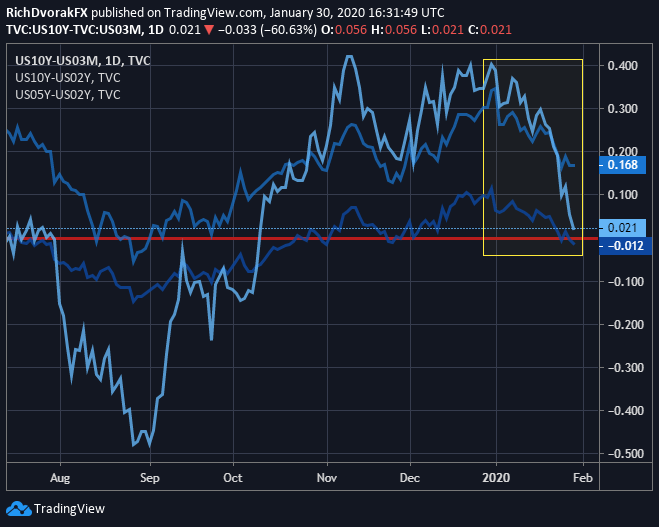
Chart created by @RichDvorakFX with TradingView
After a sharp re-steepening in the US Treasury yield curve last September, which followed confirmation of the abrupt shift in monetary policy by the Federal Reserve from hawkish to dovish, long-term interest rates have resumed their plunge lower since the start of the year.
Investors have rushed back into safe-haven assets such as 10-Year Treasury Notes recently due to resurfacing risk-aversion and could be explained broadly by skepticism toward the US-China trade deal and panic over the recent coronavirus outbreak. This is considering they both jeopardize the current global GDP growth rebound narrative.

Also, with the FOMC communicating an end to its ‘mid-cycle adjustment’ and aim to keep interest rates on hold this year, bond traders seem skeptical that the flood of accommodative action will be enough to stimulate business investment and avoid a recession that likely looms.
CHART OF S&P 500 INDEX, SPOT USD/JPY, TREASURY YIELD CURVE SPREAD

Chart created by @RichDvorakFX with TradingView
Correspondingly, the stocks in the S&P 500 Index may continue to come under pressure along spot USD/JPY.
| Change in | Longs | Shorts | OI |
| Daily | 1% | -1% | 0% |
| Weekly | 15% | -13% | -1% |
This is considering the equity benchmark and sentiment-driven currency pair are frequently strong-armed by appetite for risk, which can be roughly quantified by changes in the slope (i.e. 10-year less three-month interest rate spread) of the US Treasury yield curve.
Read More: US Yield Curve Inverts, but Panic When it Steepens
-- Written by Rich Dvorak, Junior Analyst for DailyFX.com
Connect with @RichDvorakFX on Twitter for real-time market insight


