


The S&P 500 found buyers yesterday, rising up after a subtle breach of a channel dating back to the October low. But is the rally for real or only countertrend in nature? The thinking is that there might be at least another run lower left in this down-move, if not more. A fizzle here today without much more upside would be ideal for this scenario. Watch how price action plays out with the FOMC today, it could determine the path over the next couple of days.

S&P 500 Daily Chart (barely holding channel)

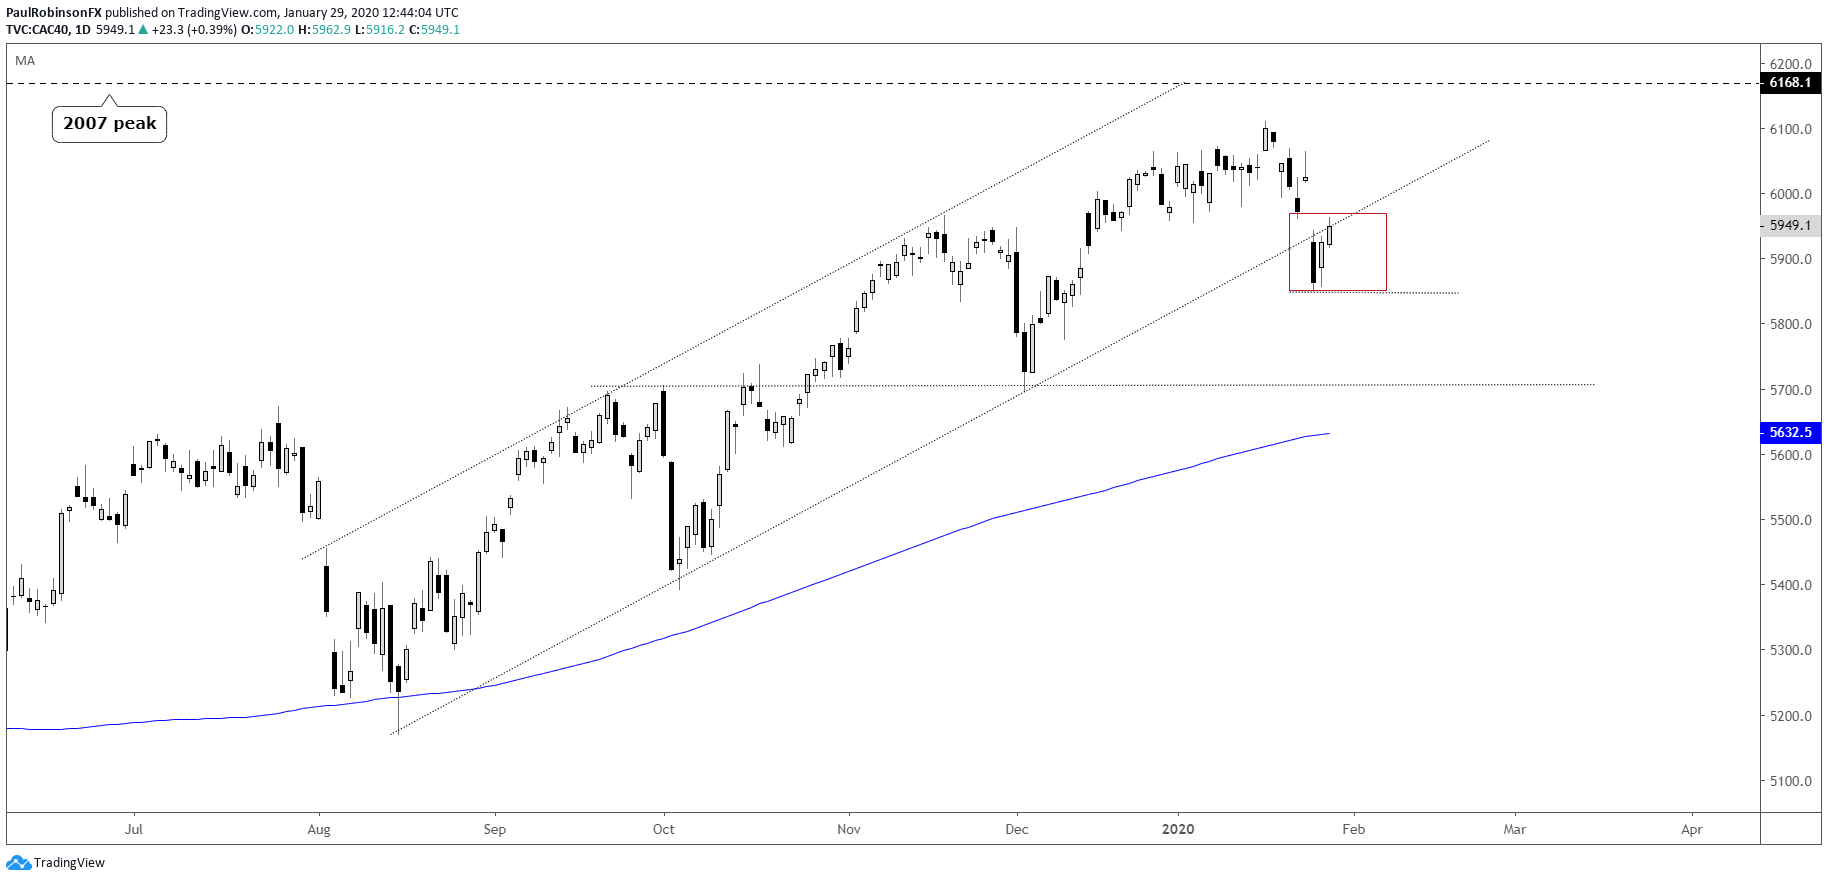
The CAC is generally showing itself to be on of the weaker major indices. The other day it broke the neat channel it was confined in since August. The past day-and-a-half bounce has the index testing the underside trend-line of the channel; a ‘kiss and turn’ may be in order. A reversal back lower and break of 5851 should bring the area around 5700 into focus.
CAC Daily Chart (broke channel, skews risk to the downside)
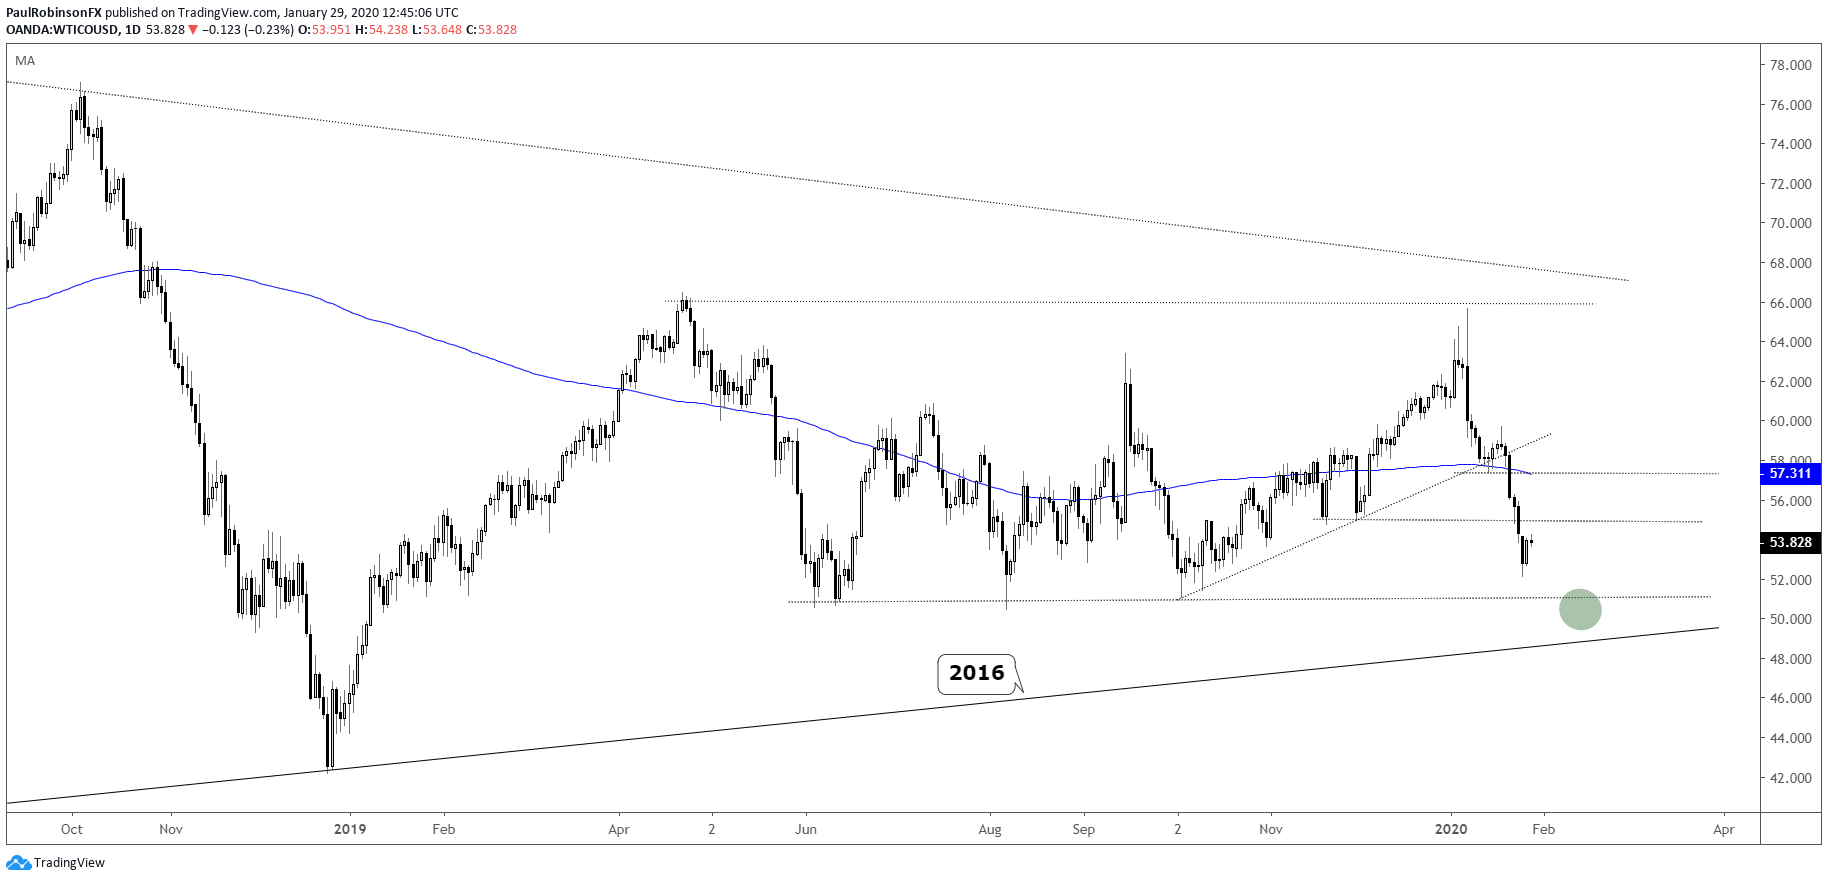
Crude oil saw some reprieve yesterday along with the risk-trade rebound. But it still has a little room to go before it firmly tests the support around the 50/51-area. There are several lows in place going back to June that could help firm up oil should it trade down there. A break through 50.48 would have the 2016 trend-line in focus at that point.

Crude Oil Daily Chart (big support just below)
Crude Oil Chart by TradingView
To see all the charts we looked at, check out the video above…
Resources for Index & Commodity Traders
Whether you are a new or an experienced trader, DailyFX has several resources available to help you; indicator for tracking trader sentiment, quarterly trading forecasts, analytical and educational webinars held daily, and trading guides to help you improve trading performance.
We also have a series of guides for those looking to trade specific markets, such as the S&P 500, Dow, DAX, gold, silver, crude oil, and copper.
---Written by Paul Robinson, Market Analyst
You can follow Paul on Twitter at @PaulRobinsonFX


