


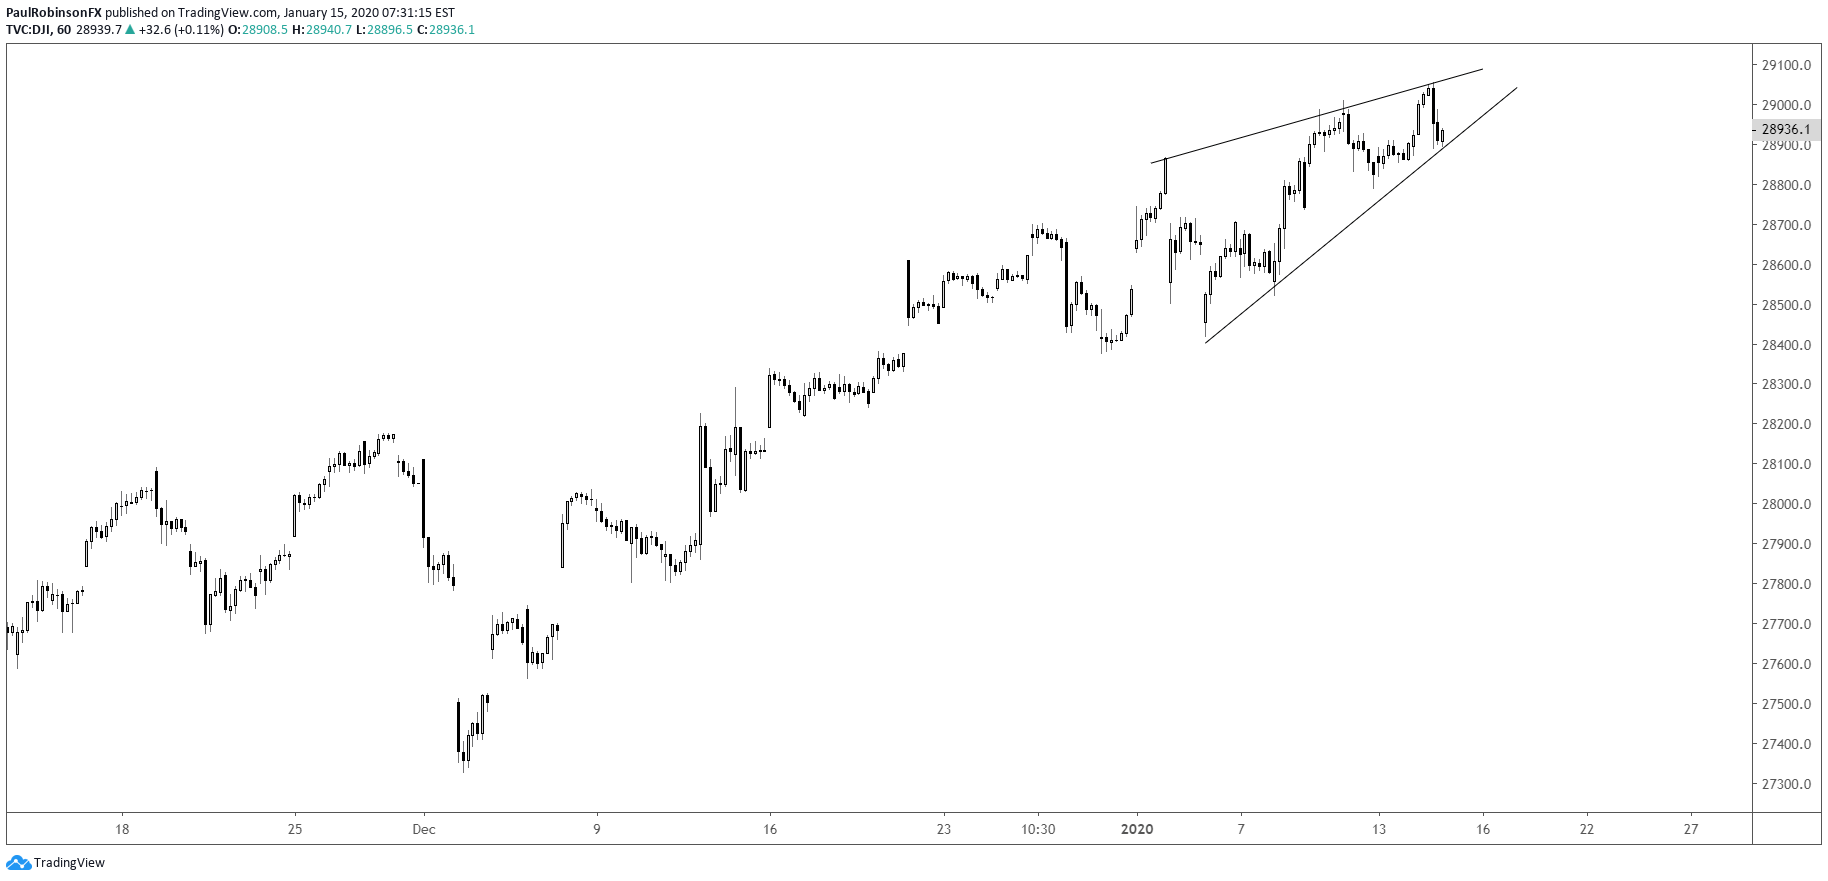
The Dow Jones, and US stocks in general have been quite bullish, but a short-term pattern along with resistance could set into motion a small short-term decline. On the daily the Dow is riding along a well-defined top-side parallel extending well into last year. It is moving in the direction of the trend, so it isn’t considered the strongest form of resistance, but resistance nevertheless. On the hourly time-frame a small rising wedge is forming, a pattern that if triggered on the downside could bring with it some short-term selling. It could always break to the top-side, so waiting for a confirmed break here will be the key.

Dow Jones Daily Chart (upper parallel)

Dow Jones Hourly Chart (small rising wedge)
Dow Jones Charts by TradingView
The DAX is caught between a rock and a hard place. It sits on top of a broken range, but just beneath the record high at 13596, making it a tough buy or sell. But the trend is up and risk sentiment is still strong, so for now giving the benefit of the doubt to the long-side to get through to a new record high.
DAX Daily Chart (out of range below ATH)

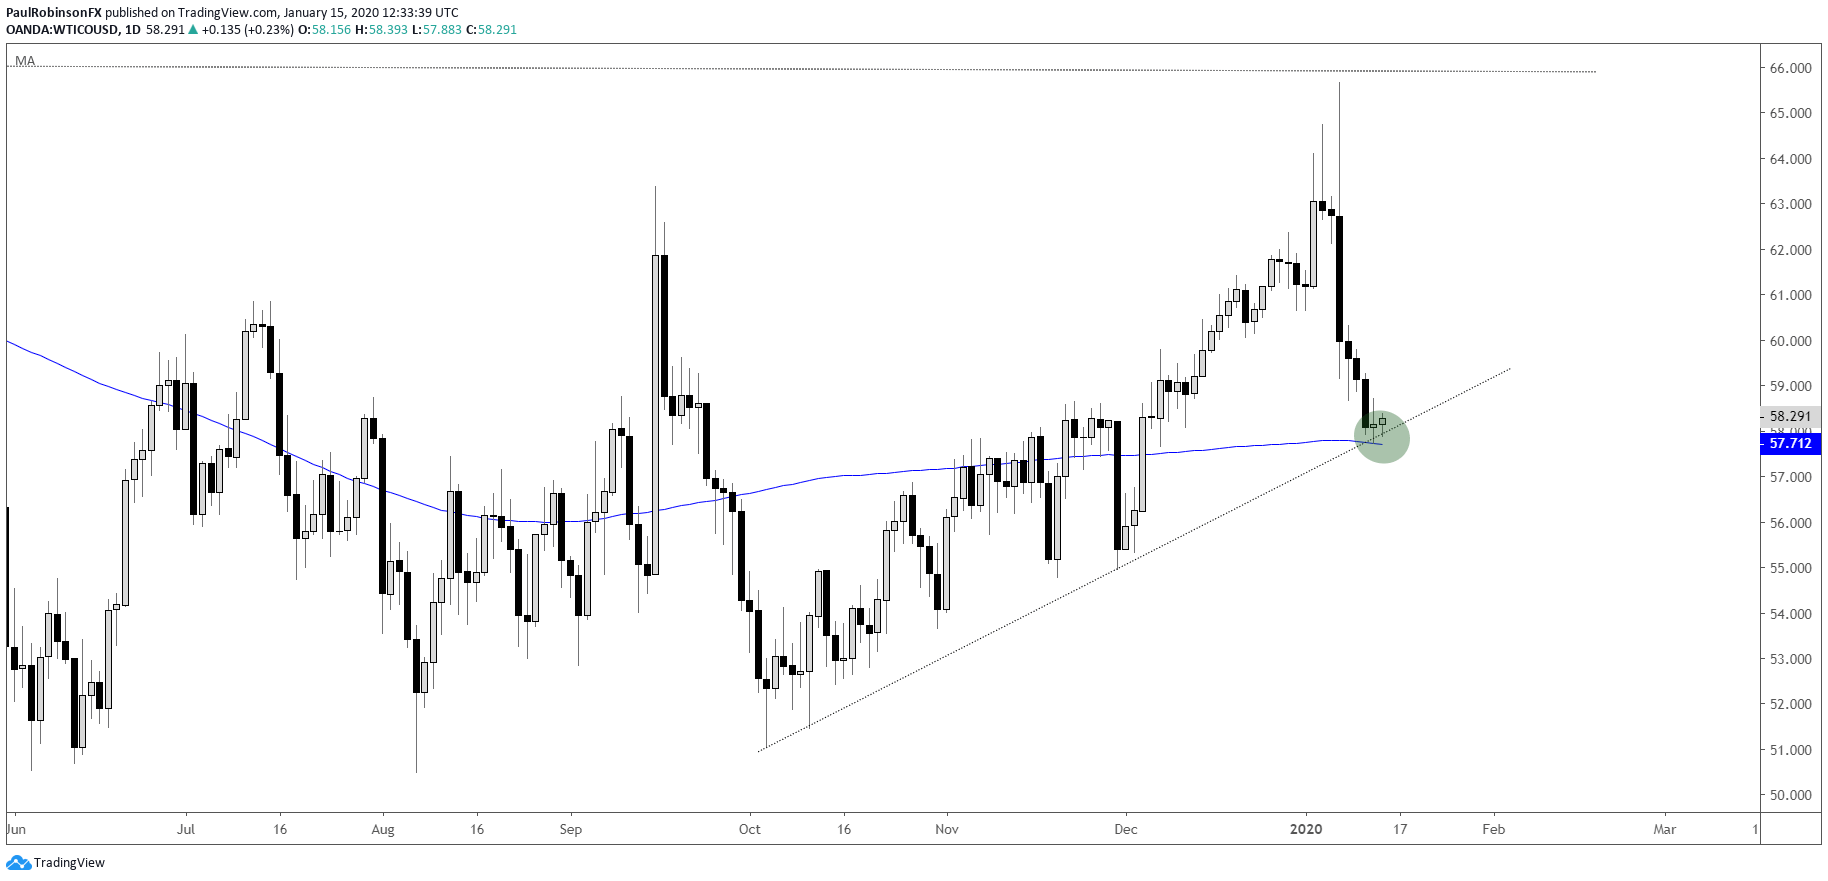
Crude oil got crushed on de-escalation in Middle East tensions, but with it having dropped down to trend-line and 200-day support it could see a bounce. That might be all the edge there is in this chart for now. Overall, oil is an avoidable market in my opinion, as there is no discernable trend or trading bias.

Crude Oil Daily Chart (reversing around major long-term resistance)
Crude Oil Chart by TradingView
To see all the charts we looked at, check out the video above…
Resources for Index & Commodity Traders
Whether you are a new or an experienced trader, DailyFX has several resources available to help you; indicator for tracking trader sentiment, quarterly trading forecasts, analytical and educational webinars held daily, and trading guides to help you improve trading performance.
We also have a series of guides for those looking to trade specific markets, such as the S&P 500, Dow, DAX, gold, silver, crude oil, and copper.
---Written by Paul Robinson, Market Analyst
You can follow Paul on Twitter at @PaulRobinsonFX


