


S&P 500 INDEX PRICE PLUNGES, VOLATILITY SPIKES ON LATEST US-CHINA TRADE WAR ESCALATION
- Investors scrambled to sell stocks in the S&P 500 Index as China threatens retaliatory tariffs and traders await Trump’s response in the latest US-China trade war escalation
- Volatility, measured via the VIX Index, is soaring as risk assets come under pressure and uncertainty runs rampant
- Find out if you possess the Top Traits of Successful Traders
Risk assets like equities in the S&P 500 Index swooned during Friday’s trading session after a series of blows rattled the stock market and investor confidence. Correspondingly, the VIX Index – a closely watched fear-gauge that measures 30-day implied volatility on the S&P 500 – exploded higher as uncertainty runs rampant in light of the latest US-China trade war escalation and vague language within Fed Chair Powell’s speech at Jackson Hole.
S&P 500 INDEX PRICE CHART: 5-MINUTE TIME FRAME (AUGUST 23, 2019 INTRADAY)
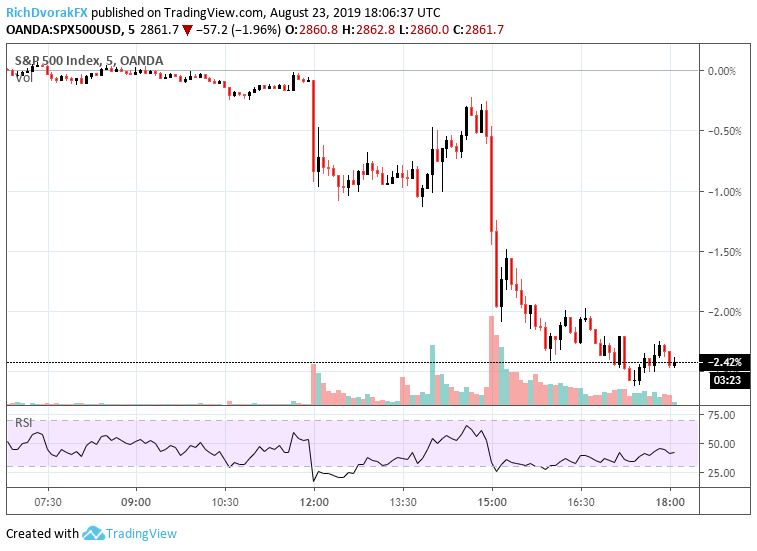
Chart created by @RichDvorakFX with TradingView
The S&P 500 Index sunk well over 2% during Friday’s trading session, but price action was quite choppy prior to a series of Trump tweets blasting the Federal Reserve and China. Equities dropped a modest -0.5% in early morning trade prior to the New York opening bell on news that China will levy retaliatory tariffs on roughly $75 billion of US goods, but stock prices were largely kept afloat by hopes that Chair Powell and the Federal Reserve would signal intent to match the market’s lofty rate cut expectations.
Although the Fed’s Powell expressed openness to dovish FOMC action considering “further evidence of a global slowdown” while “business investment and manufacturing have weakened,” the lack of commitment to providing more accommodative monetary policy disappointed investors – and POTUS. Minutes after Powell concluded, President Trump lashed out on his Twitter account saying that “The Fed did nothing” and in a separate tweet posing the question “Who is our bigger enemy, Jay Powell or Chairman Xi?”
S&P 500 INDEX PRICE CHART: DAILY TIME FRAME (APRIL 30, 2019 TO AUGUST 23, 2019)
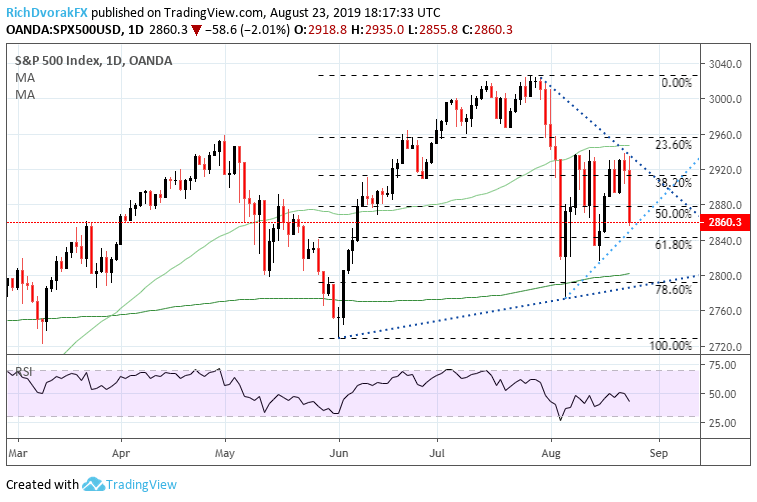
Chart created by @RichDvorakFX with TradingView
Trump’s jabs at Powell and the Fed were subsequently followed by harsh remarks directed at China, which further fueled investor angst. In turn, the S&P 500 Index swooned while volatility skyrocketed as traders scrambled to discern how Trump might retaliate. From a technical standpoint, the sharp slide in stock prices reiterated confluent resistance around the 2,940 level on the S&P 500 Index.
Technical resistance also highlighted by the S&P 500 Index’s 50-day simple moving average, which investors have struggled to overcome since prices slipped beneath this level earlier this month, as well as the newly-formed downtrend could provide an encouraging sign for stock market bears. Looking to the downside, the S&P 500 Index could find support from its short-term bullish trendline extended from the series of higher lows throughout August and just so happens to align closely to the 61.8% Fibonacci retracement of the June-July rally around 2,840.
VIX INDEX PRICE CHART: DAILY TIME FRAME (FEBRUARY 25, 2019 TO AUGUST 23, 2019)
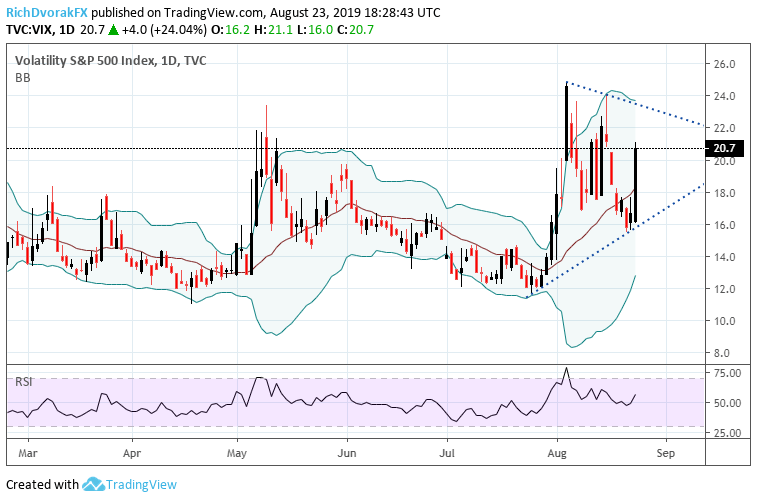
Chart created by @RichDvorakFX with TradingView
The daunting threat of escalating US-China Trade War tensions coupled the potential that Powell and the FOMC will refuse to match the market’s rate cut expectations unsurprisingly sent the VIX Index surging. Volatility, which typically holds a strong inverse relationship to the S&P 500 and other risk assets, appears set to continue its climb to highs printed earlier this month near the 22.00 mark – particularly if equities keep hemorrhaging.
VOLATILITY IN US EQUITIES & EMERGING MARKETS APPEARS TO FOLLOW CHINESE YUAN

Chart created by @RichDvorakFX with TradingView
Other volatility barometers aside from the VIX Index, like Cboe’s Emerging Markets ETF Volatility Index (VXEEM), spiked similarly. Also, the relationship between volatility indices like the VIX and VXEEM interestingly follows spot USDCNH price action. That said, watching the Chinese Yuan as a US-China Trade War guage has so far served well, and the recent runup in spot USDCNH could point to a further rise in volatility and drop in equities.
-- Written by Rich Dvorak, Junior Analyst for DailyFX.com
Connect with @RichDvorakFX on Twitter for real-time market insight


