


S&P 500 Outlook:
- Volatility remains abundant as stocks jostled throughout Thursday trading
- The S&P 500 was able to eek out a daily close above two technical levels that could provide support headed into next week
- Sign up for our Free Weekly Equity Webinar in which critical technical levels and fundamental themes are analyzed each week
S&P 500 Forecast: Stocks Threaten Breakdown as TLT ETF Soars
The S&P 500 closed 0.2% higher after paring losses established earlier in the session. While strong earnings from Walmart (WMT) and Alibaba (BABA) helped to stall declines, investors are still wary of an extended recovery – as evidenced by collapsing treasury yields. Consequently, the TLT ETF, which seeks to track the investment results of an index composed of U.S. Treasury bonds with remaining maturities greater than twenty years, touched all-time highs.
TLT ETF Price Chart: Daily Time Frame (2002 – 2019) (Chart 1)
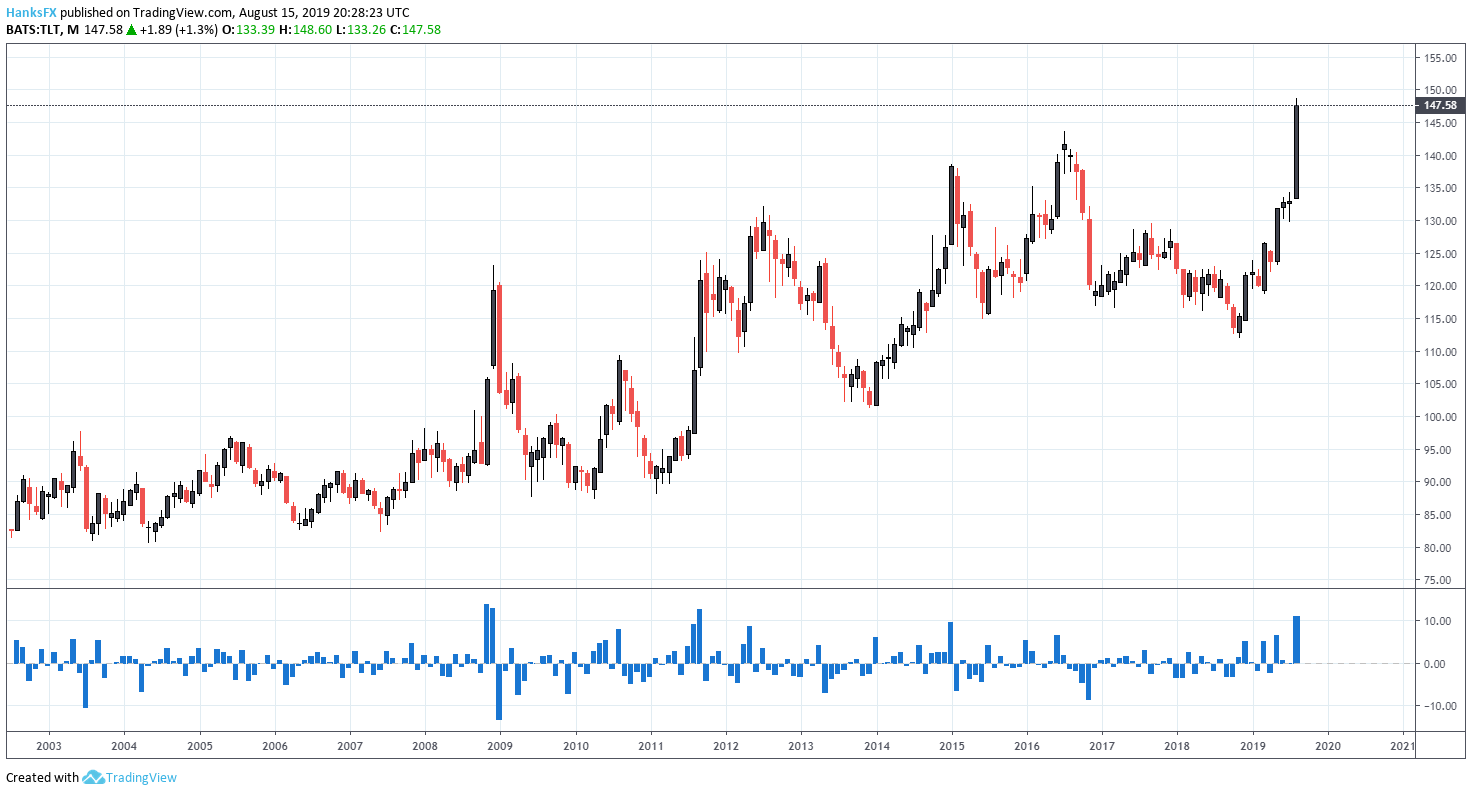
Chart created with TradingView
Coinciding with heightened stock market volatility and growing uncertainty about the health of the US economy, the TLT ETF is on pace for its largest 1-month return since September 2011 – with two more full trading weeks. Further, TLT boasts a return of nearly 21% in the year-to-date, now outpacing the S&P 500 and even Nasdaq 100 which have gained 13.5% and 17.8% in 2019 respectively. The continuous demand for safety speaks to the ongoing uncertainty among traders and has resulted in robust capital flows into TLT.
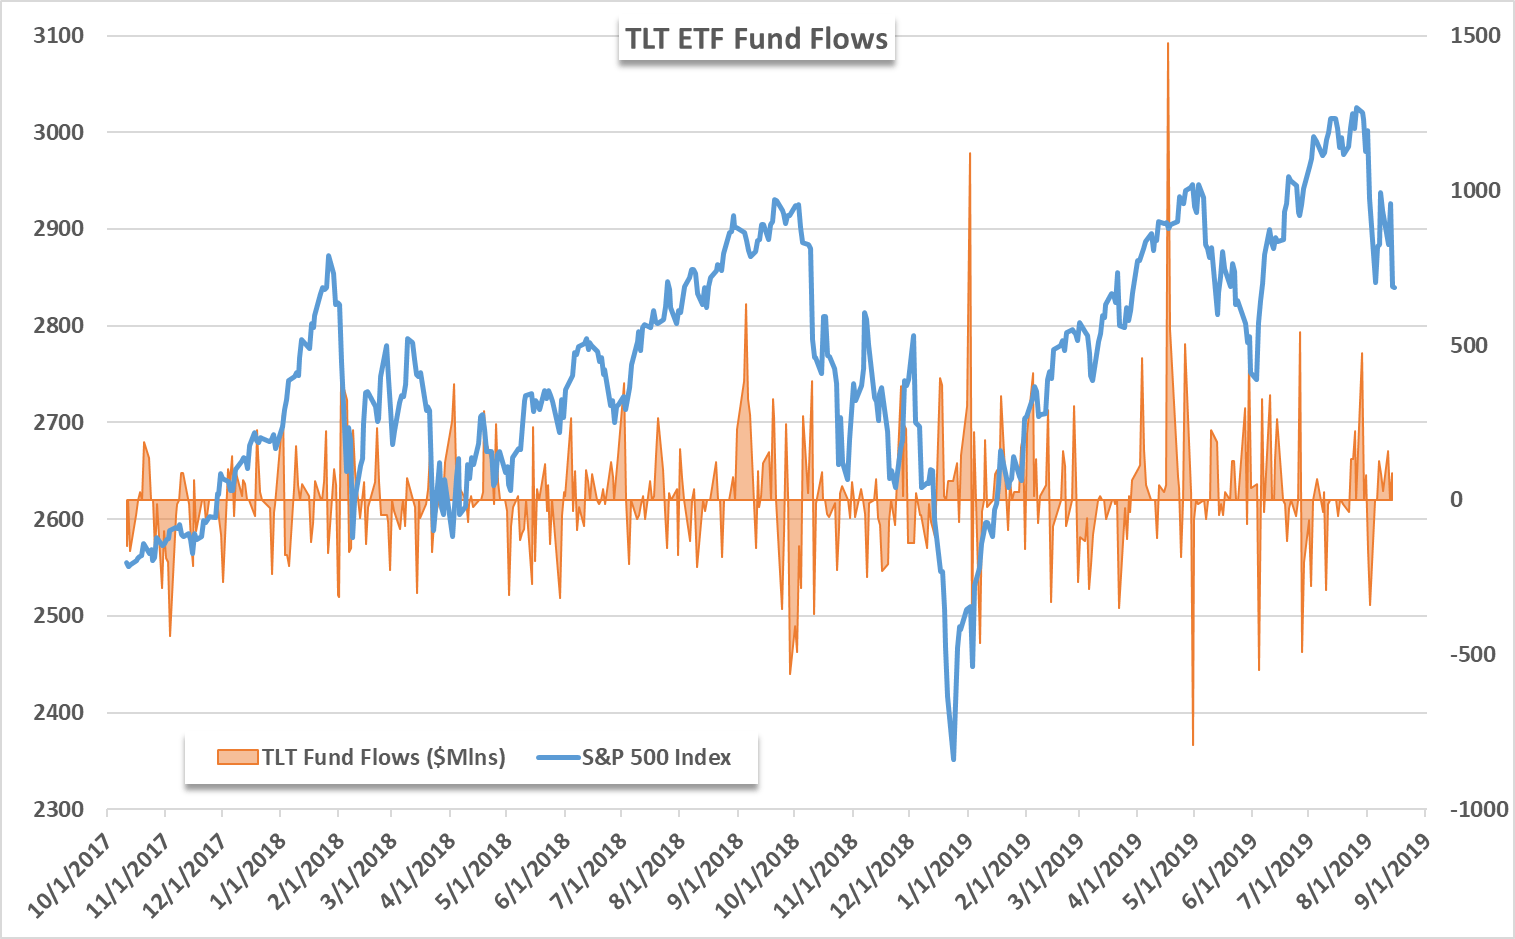
Boasting net inflows of nearly $4.8 billion in 2019, TLT is in the process of posting two-straight weeks of net inflows – despite forecasted Fed rate cuts. While an inversion of the yield curve and soaring demand for TLT paint a bleak picture for the S&P 500, the Index was able to narrowly close above a possible trendline heading into Friday trading. Further, strong earnings from Nvidia (NVDA) could look to bolster the tech sector and Nasdaq 100 as I outlined yesterday.
S&P 500 Price Chart: 4 – Hour Time Frame (June – August) (Chart 2)
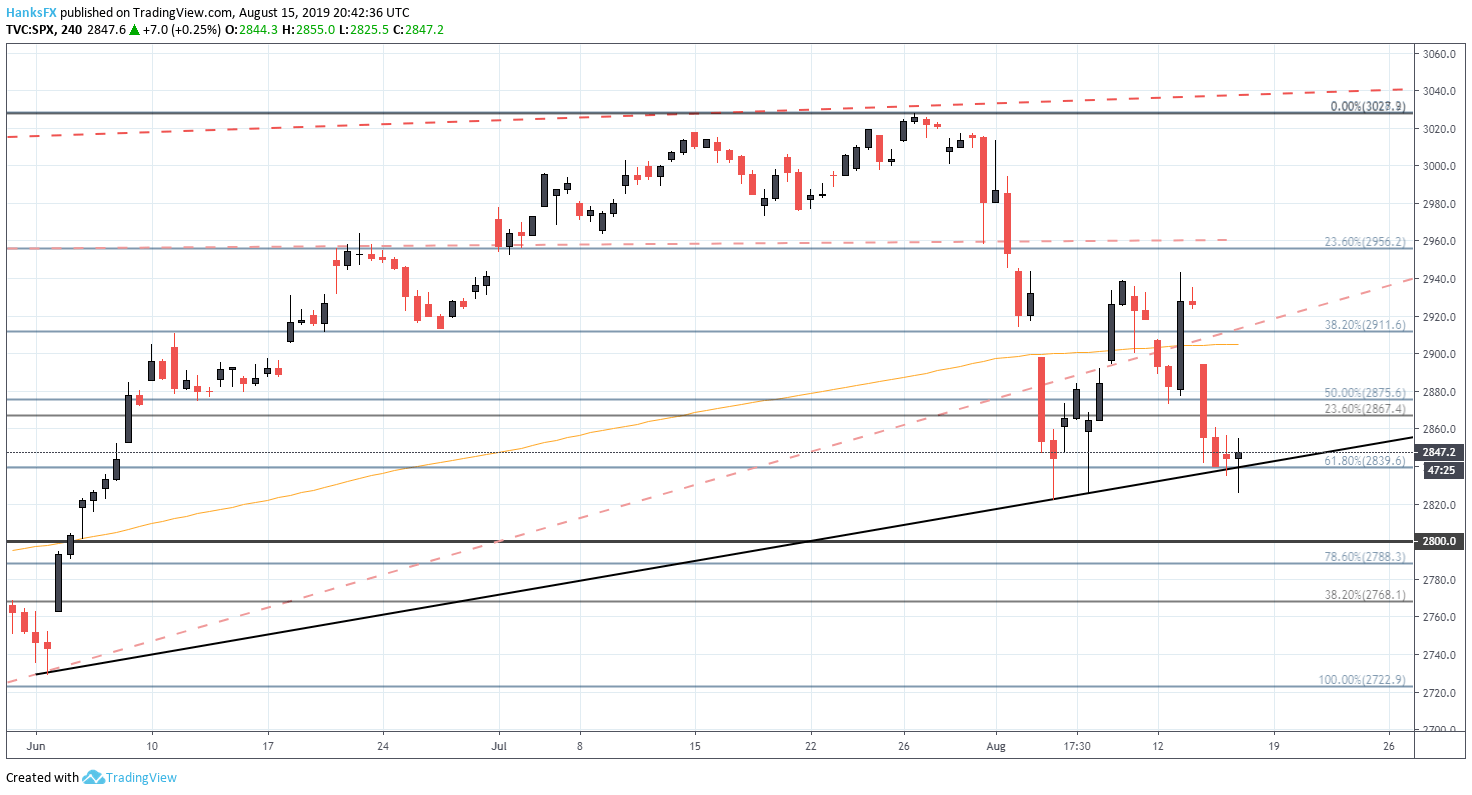
Chart created with TradingView
After closing slightly above trendline support from June, traders could use the technical barrier as an excuse – or an opportunity – to explore long positions heading into the weekend. Fibonacci support is also nearby at the 2,840 level and bulls will look for any and all assistance they can get after the last two weeks of turmoil for the SPX. Should risk aversion reignite, subsequent support can be looked to at the 2,800 and 2,740 levels – with various areas of minor buoyance in between.
Interested in longer-term trade ideas? Check out our Quarterly Forecasts for the Dow Jones, US Dollar, Gold and more.
Despite what some financial news media and talking heads would have you believe, the S&P 500 still maintains an above average return in the year-to-date. To that end, it is important to keep recent stock market price action in perspective of the longer-term.
While the various recession indicators are undoubtedly cause for concern, trading filled with emotion could muddy entry and exit points and cloud analysis. It is in conditions such as these that a sound strategy and level head will pay dividends. For more technical analysis and fundamental updates on the major equity markets, follow @PeterHanksFX on Twitter.
--Written by Peter Hanks, Junior Analyst for DailyFX.com
Contact and follow Peter on Twitter @PeterHanksFX
Read more: Dow Jones, Nasdaq 100, S&P 500 Forecast: ETF Flows Hint at Bearishness


