


Dow Jones, Nasdaq 100, S&P 500 Forecast:
- The SPY ETF recorded the largest intraday outflow since October’s equity rout
- Data from prior outflows of such magnitude suggest equity turmoil may persist
- Sign up for our Weekly Equity Outlook Webinar to gain stock market insight through the lens of global macro trends.
Dow Jones, Nasdaq 100, S&P 500 Forecast: ETF Flows Hint at Bearishness
Monday saw the Dow Jones plummet over 750 points after a significant escalation in the US-China trade war. Investor confidence was rocked as traders scurried to reduce exposure to the S&P 500, Nasdaq 100 and Dow Jones. ETF flow data recorded by Bloomberg reveals the capital flight for some of the market’s largest funds was similar to that of the reallocation during the equity rout last October.
Investors Ditch S&P 500 Exposure
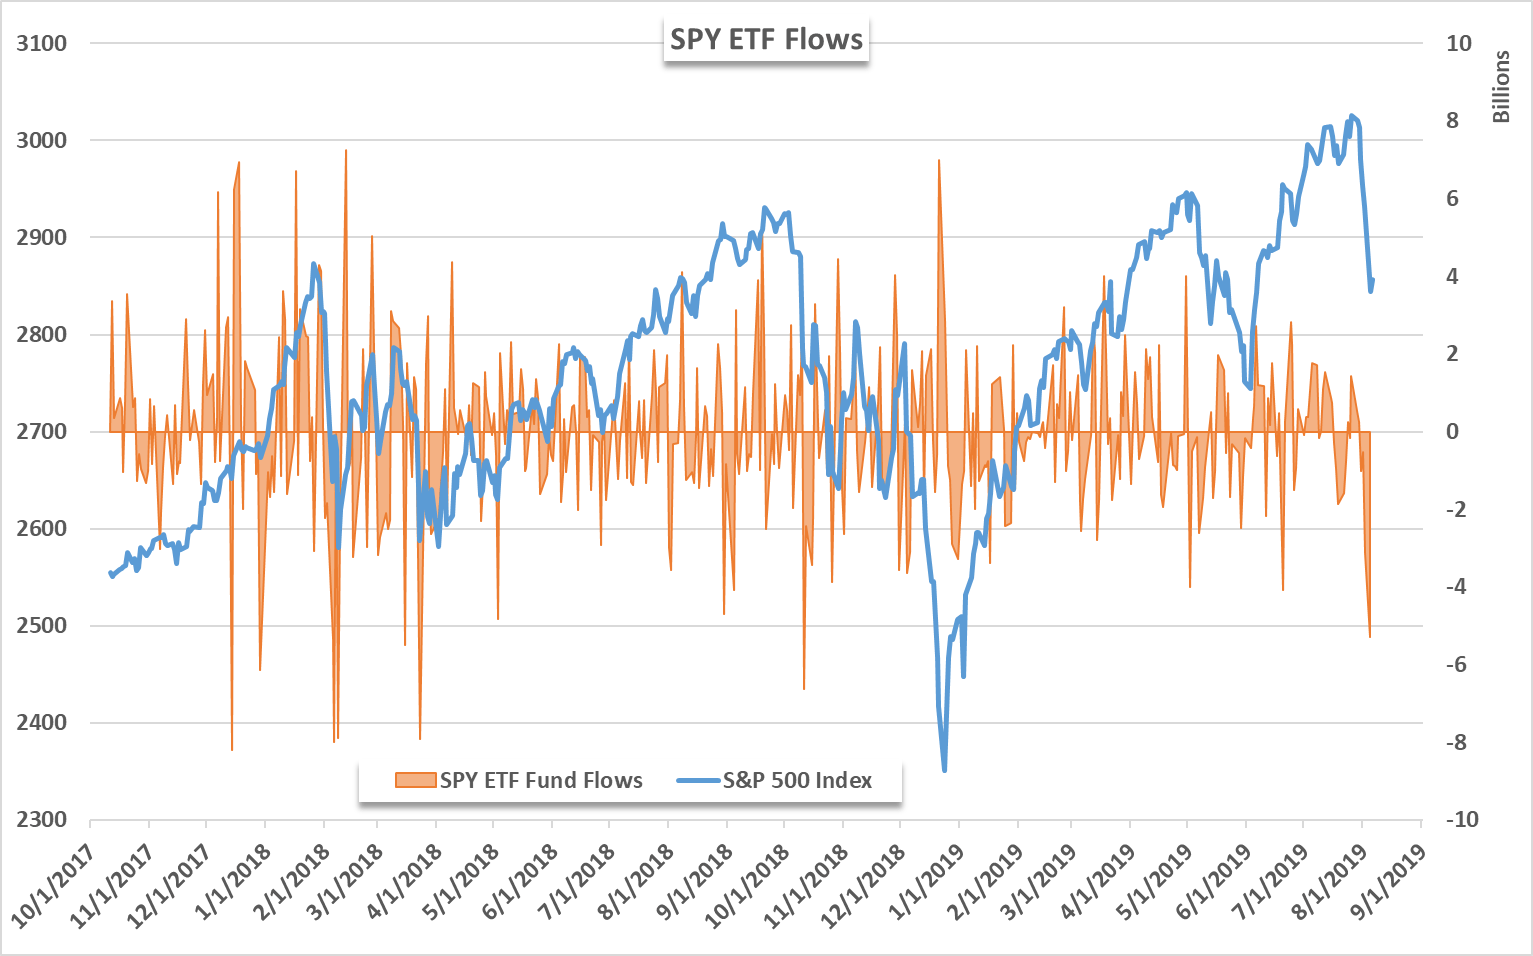
To that end, over -$5.2 billion exited the SPY ETF during Monday’s session. The outflow is the largest on an intraday basis since October 11, 2018 when the S&P 500 dropped -2%. Across a broader timeframe, the SPY ETF has now seen almost -$9 billion leave its coffers in the month of August alone. Monday’s outflow puts the year-to-date net flows at a negative $17.4 billion. The staggering exodus of funds is just the seventh instance of an outflow over -$5 billion since the beginning of 2018.
Unfamiliar with past trade wars? Check out our guide,A Brief History of Trade Wars.
That said, Monday’s outflow narrowly made the $5 billion cutoff and is the smallest instance above the watermark. While seemingly an arbitrary hurdle, capital migration of such magnitude - from the world’s most liquid ETF – is indicative of significant risk aversion and suggests larger thematic issues are at play. At present, the greater concern lies with trade wars and investors have signalled they are not comfortable with equity exposure given the current path and pace of escalation in the conflict.

If history is any indication, prior instances of such outflows are typically followed by continued risk aversion in the week after as evidenced by data from the last 20 months. Whether the theme continues to evolve or the initial explosion results in contagion and sparks further selling, subsequent price action suggests investors are hesitant to jump back into the fray. Given the size of Monday’s jolt, which was comfortably above average, investors may linger on the sidelines for longer.
For updates and analysis on fund flow data along with corresponding historical returns, follow @PeterHanksFX.
As the jitters from the initial shock subside, however, investors appear much more willing to accept risk with an average return of around 0.18% over the following month. With that in mind, we can attempt to chart possible price levels using the average decline in the week to follow using Monday’s closing price.
S&P 500 Price Chart
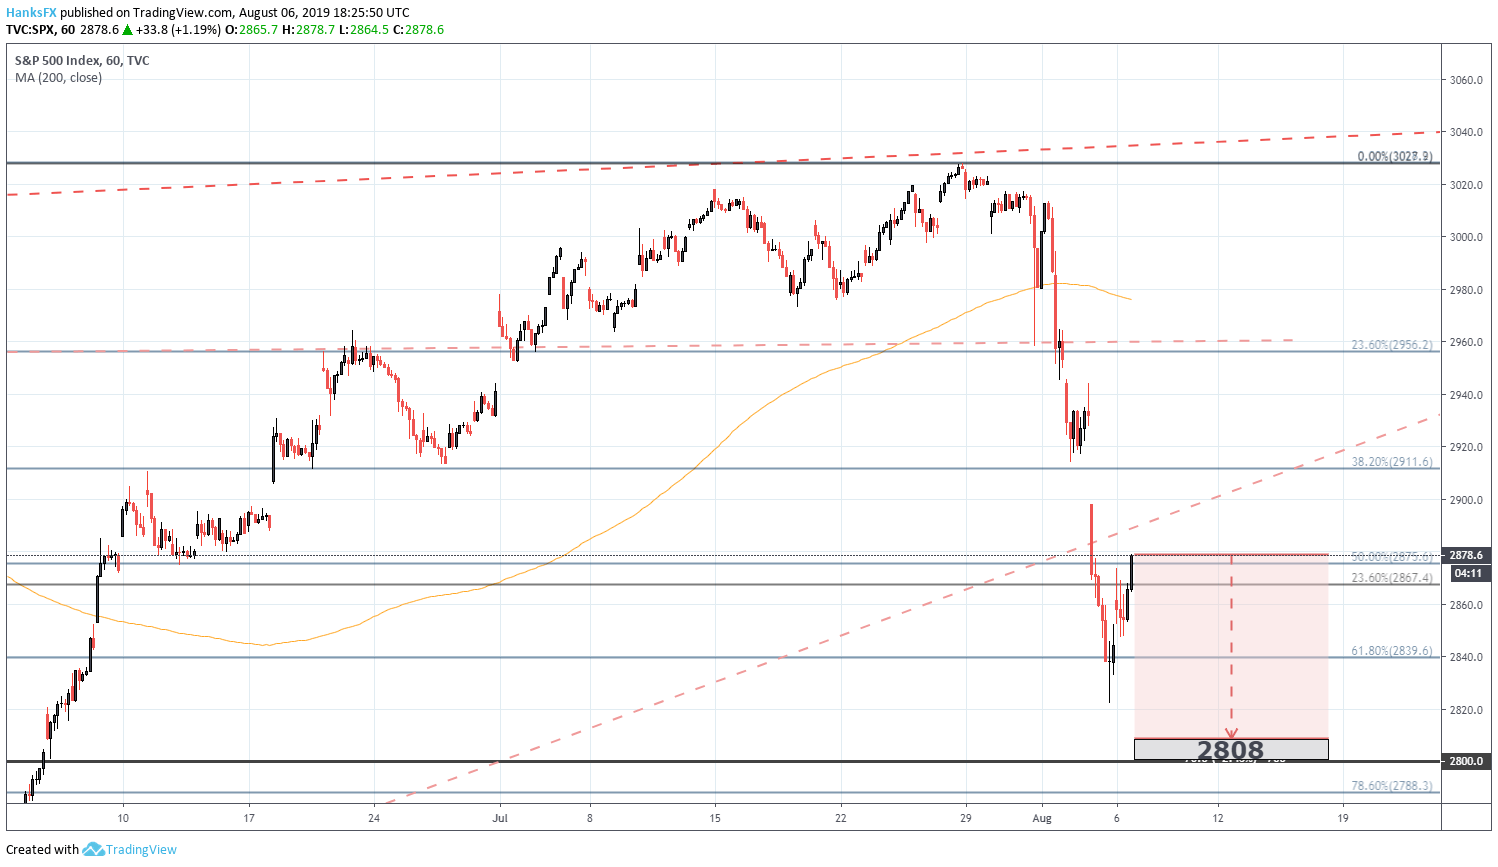
Concluding the session at 2,845, another 1.3% chunk out of the S&P 500 would subtract roughly 37 points from the Index and place it around 2,808. This does not include Tuesday’s price action which saw the S&P 500 rebound to the 2,870 area. Still, technical support between spot prices and 2,808 is relatively sparse and above the 200-day moving average. That leaves support around the 2,840 level and the low from Monday’s session at 2,822 as potential levels of buoyance.
While these calculations are far from an exact science and past performance is not indicative of future results, it may give a glimpse of notable price levels if bearishness is to resume later in the week. The fundamental drivers behind the initial move are far from resolved – and have arguably deteriorated further – so there should still be cause for concern among many investors.
--Written by Peter Hanks, Junior Analyst for DailyFX.com
Contact and follow Peter on Twitter @PeterHanksFX
Read more: Stocks Sink After President Trump Announces New Tariffs on China


