


ASX 200 Outlook:
- Despite a serious uptick in the US-China trade war, a dovish Australian central bank has helped keep the ASX 200 within reach of all-time highs
- If the RBA hints that they might match the neighboring Reserve Bank of New Zealand and offer further easing, a recovery to all-time highs may be in the cards
- Check out the DailyFX Podcast with Andrew Milligan, head of global strategy at Aberdeen Standard Investments
ASX 200 Forecast: Can Bulls Mount a Rebound to All-Time Highs?
Risk appetite continued to resurface with the Dow Jones and S&P 500 rallying through Thursday’s session. As Asia’s Friday session approaches, the ASX 200 could look to enjoy – and potentially help extend – the risk-on attitude exhibited in equity markets during the latter half of the week. With a market devoid of new trade war rhetoric and few scheduled events on the docket, the prevailing trend may continue.
ASX 200 Price Chart: 1 - Hour Time Frame (March – August) (Chart 1)
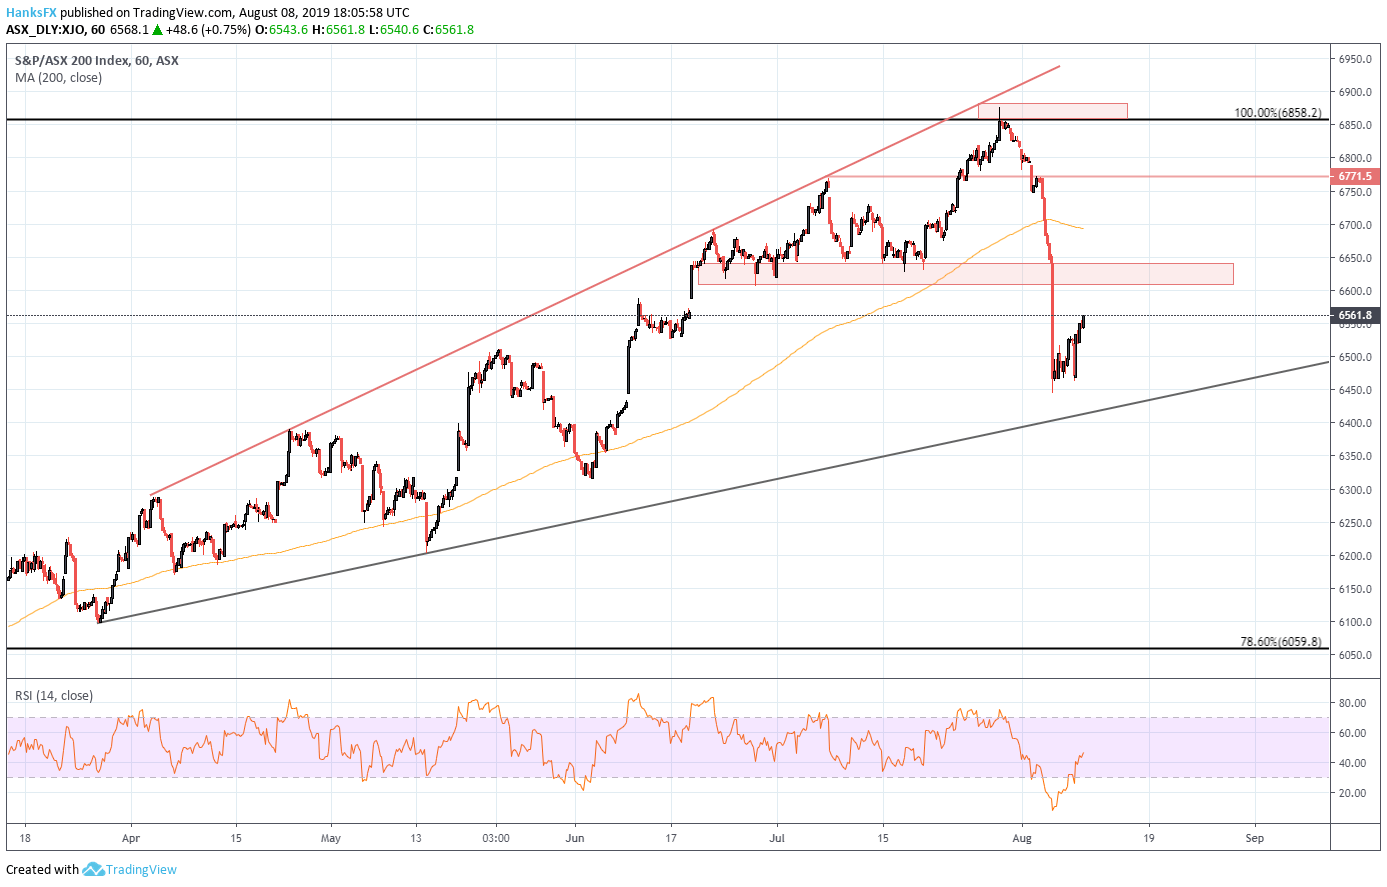
Chart created with TradingView
That said, the Index will have to surmount technical resistance around 6,644. The area provided support for the Index throughout June and July but after a precipitous breakdown on Monday, the zone will now look to rebuke an attempted recovery. Subsequent resistance may reside around 6,770, marked by a swing high in early July, and 6,846 – the Index’s all-time high. While the path higher is far from unobstructed, the barriers have somewhat weak technical merit over the longer-term apart from 6,846. On the other hand, nearby support should possess greater price influence.
Unfamiliar with past trade wars? Check out our guide,A Brief History of Trade Wars.
Trading near 6,562 at the time of this article’s publication, the ASX 200 has two notable support levels in close proximity. At 6,458, the 200-day moving average on the 4-hour chart resides which appears to have played a part in stalling the descent on Monday and Tuesday.
ASX 200 Price Chart: 4 – Hour Time Frame (March – August) (Chart 2)
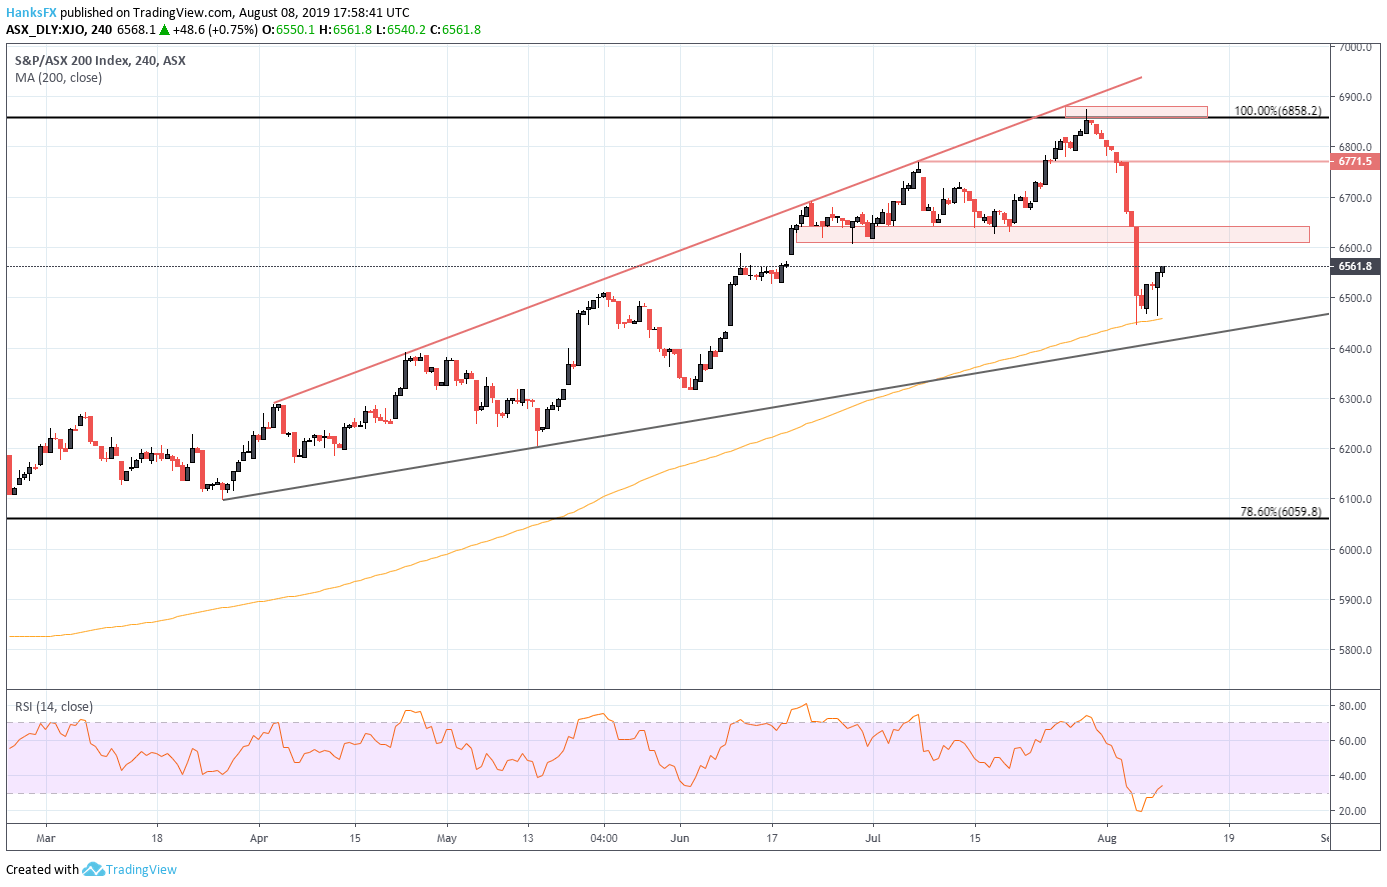
Chart created with TradingView
Secondarily, a rising trendline from late March will look to provide support if the initial level is rendered obsolete. As price action unfolds, follow @PeterHanksFX for updates and analysis on the fundamental and technical factors impacting the ASX 200. While the technical picture may be conducive to a continuation higher - and fundamental headwinds seem to have momentarily give way to a rebound in optimism - any recovery could be immediately undone if another US-China trade war escalation is delivered. With that in mind, traders should employ careful risk management practices on any trade.
--Written by Peter Hanks, Junior Analyst for DailyFX.com
Contact and follow Peter on Twitter @PeterHanksFX
Read more: Dow Jones, Nasdaq 100, S&P 500 Forecast: ETF Flows Hint at Bearishness


