


Dow Jones Price Outlook:
- The Dow Jones, S&P 500 and Nasdaq 100 all fell under considerable pressure as volatility spiked
- Concern was widespread as risk aversion reverberated across the financial world from stocks to currencies alike
- Sign up for our Weekly Equity Outlook Webinar to gain earnings insight and stock market analysis through the lens of global macro trends.
Dow Jones Suffers Largest Decline in 2019 as Trade War Fears Rage
The Dow Jones plummeted more than 750 points on Monday after Chinese leadership told state buyers to halt all purchases of US agricultural products. The announcement was made in response to President Trump’s trade war escalation on Thursday. Alongside the decision to avoid US agriculture, the People’s Bank of China allowed USDCNH to pierce 7.00 – a monumental development in the ongoing economic conflict as it signals a willingness to engage in a currency war.
USD/CNH Pierces 7.00 Ceiling
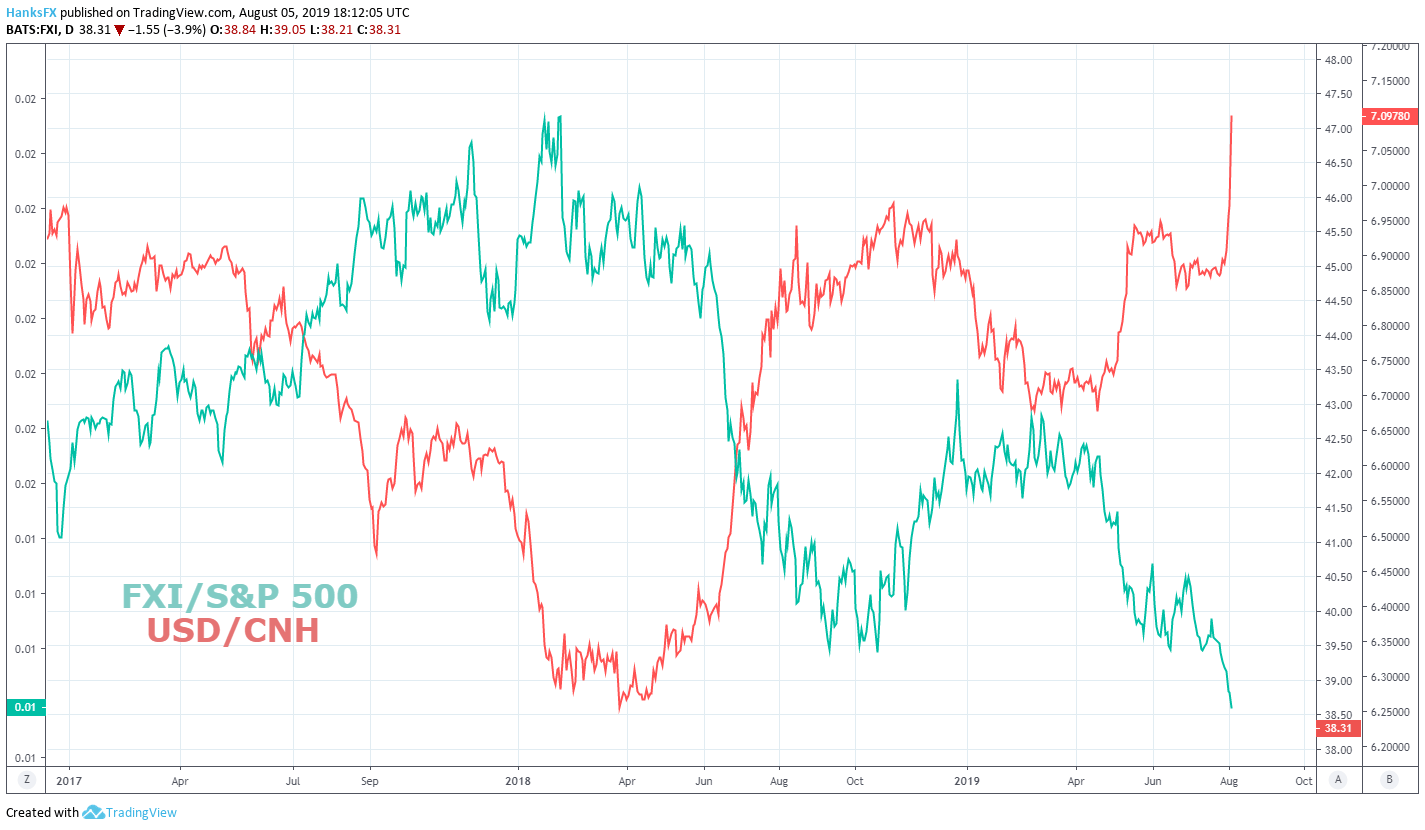
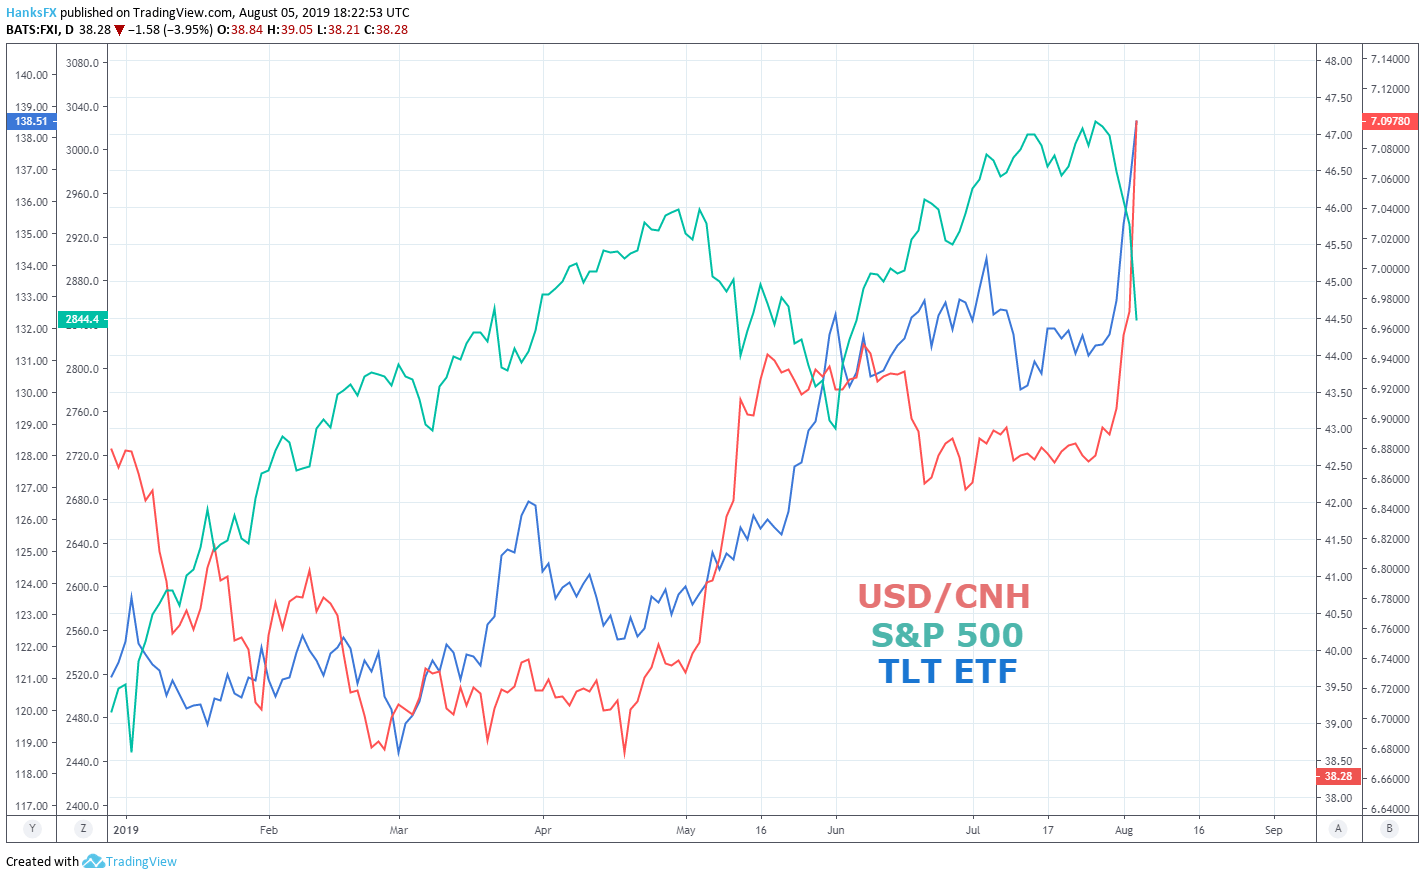
That willingness and its deeper implications was not lost on investors as they poured out of the FXI ETF which offers exposure to large cap Chinese corporations. On the back of the Yuan’s devaluation, the ratio of FXI to the S&P 500 slipped to the lowest in the fund’s 14-year lifespan. Simultaneously, the TLT ETF – an investment that offers exposure to long-term US treasuries – has rallied to outperform the S&P 500 and Dow Jones in the year-to-date, revealing investors’ demand for safety even as yields slip.
Investors Clamor for Safety in the TLT ETF
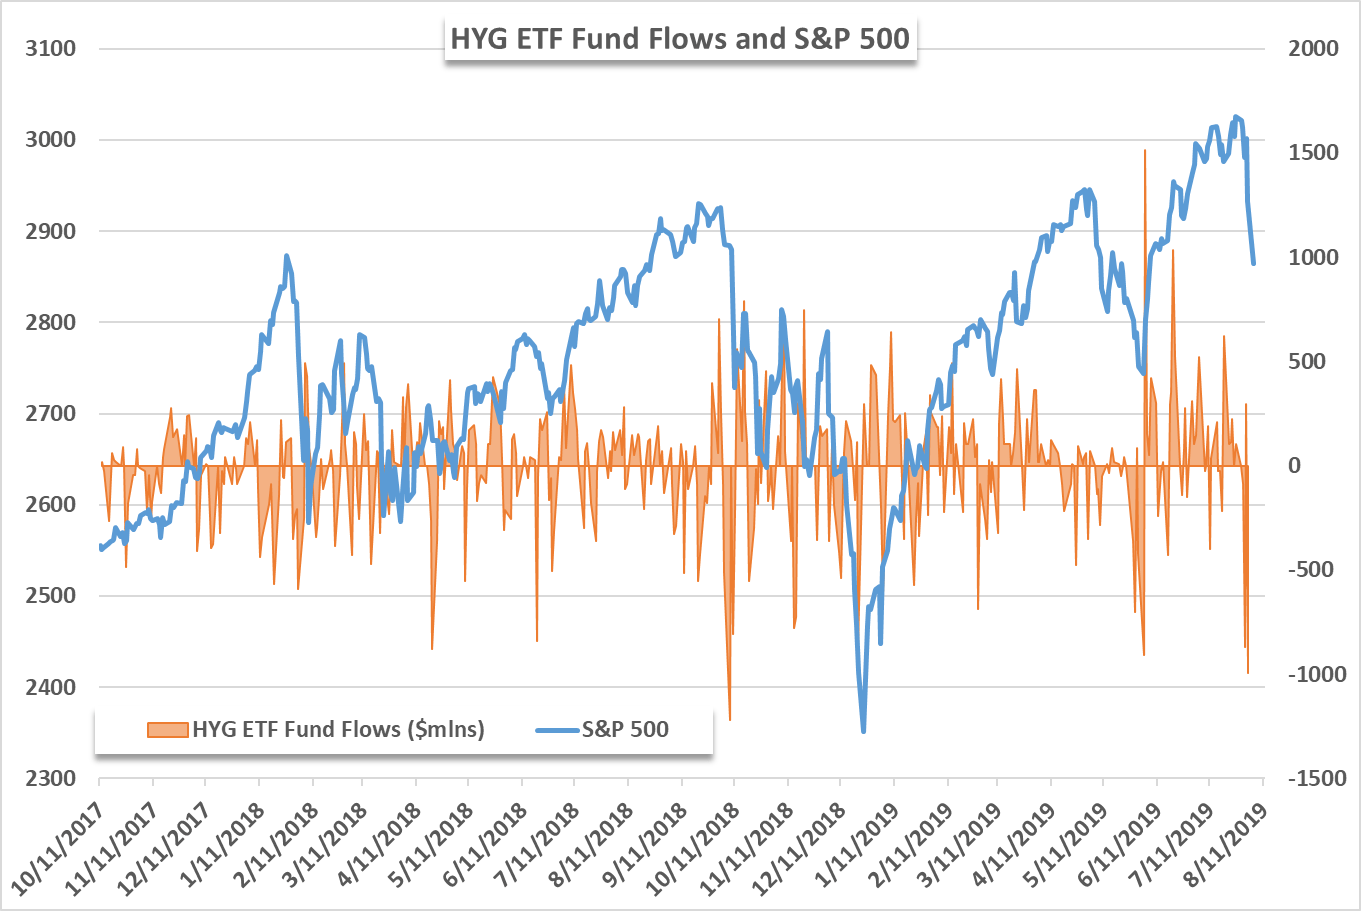
On the other side of the risk-spectrum, the HYG ETF suffered its largest intraday outflow of 2019 which is also the largest outflow since equity rout last October. The decision to ditch the high-yield corporate debt ETF is rather unsurprising, but the degree to which the fund registered outflows is noteworthy. Given the magnitude of the flows relative to Friday’s price action, one could assume Monday’s capital reallocation will likely deliver a remarkable outflow. For updates and analysis on fund flow data, follow on Twitter @PeterHanksFX.
Unfamiliar with past trade wars? Check out our guide,A Brief History of Trade Wars.
While the opposite ends of the risk spectrum have diverged sharply, assets with revenue streams tied to China have also suffered. To that end, the Nasdaq 100 posted a decline of nearly 4% as tech giants like Apple and Microsoft paved the way lower. Elsewhere, semiconductor manufacturers with significant exposure to China – like Micron (MU) and Qualcomm (QCOM) – did their part in dragging the Nasdaq lower. Interestingly, the tech-heavy Index enjoys arguably the rosiest technical backdrop of the three major US indices.
Nasdaq 100 Price Chart
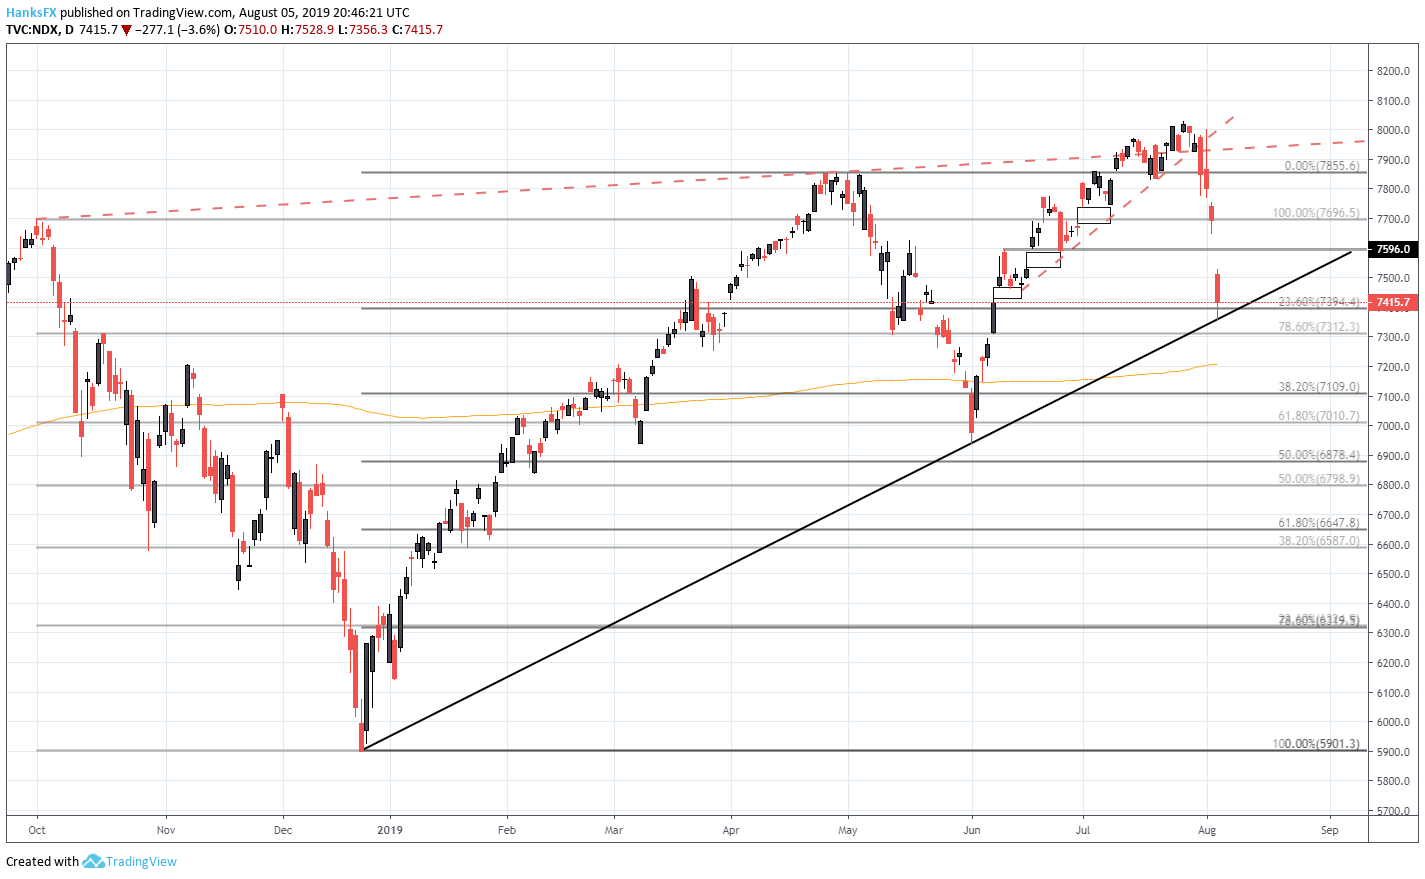
While the Dow Jones clings to bullish hopes around the 200-day moving average, it and the S&P 500 have already been dealt a serious technical blow after slipping beneath the ascending trendline marked by the lows in December and June. Monday’s price action has left the Nasdaq as the sole Index above this trend which offers a modicum of encouragement into Tuesday trading. Should the trend break, the Index’s 200-day moving average around 7,200 will look to refute a continuation lower.
Dow Jones Price Chart
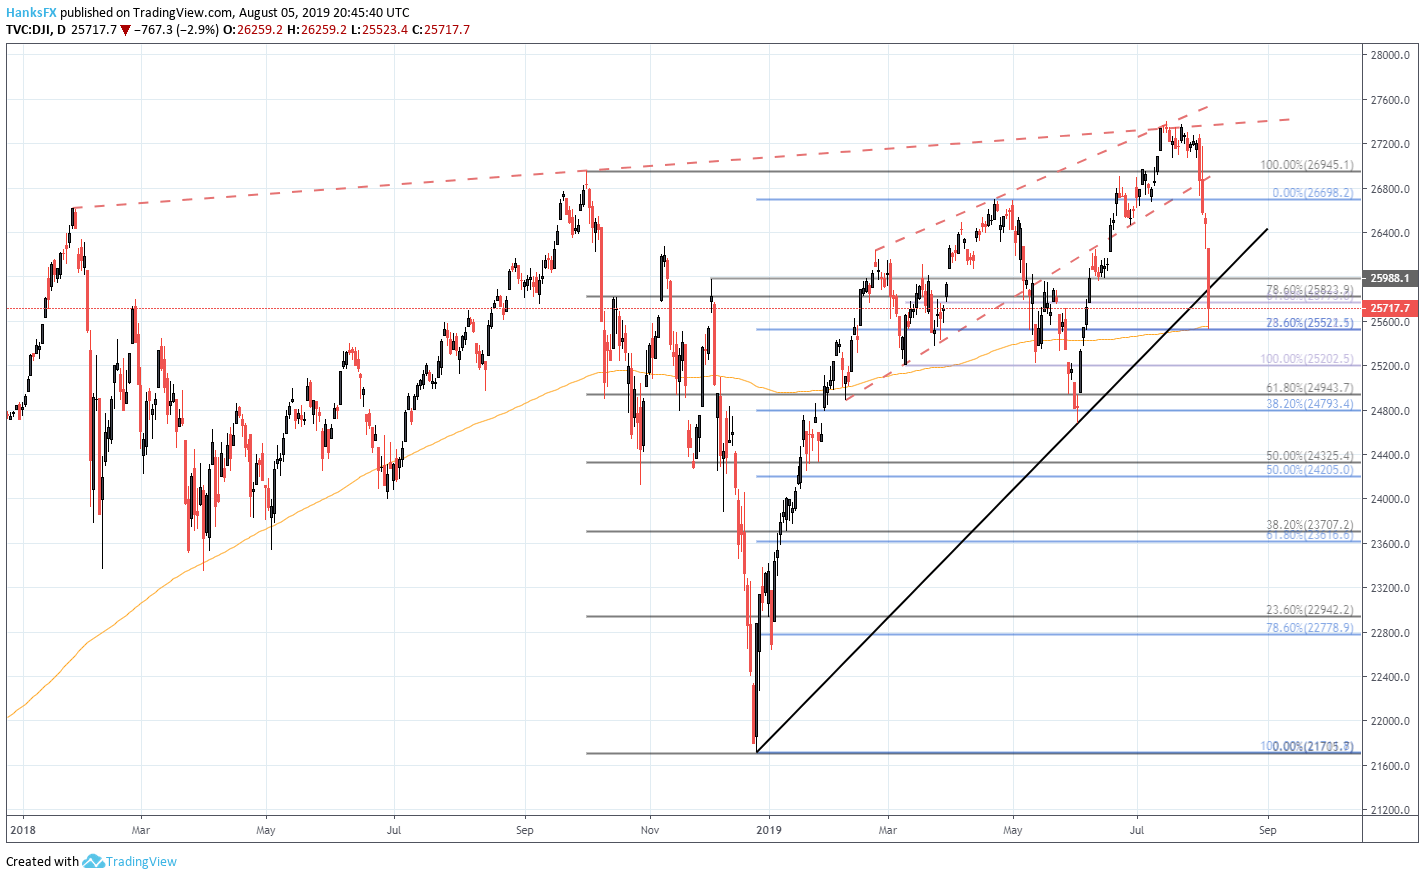
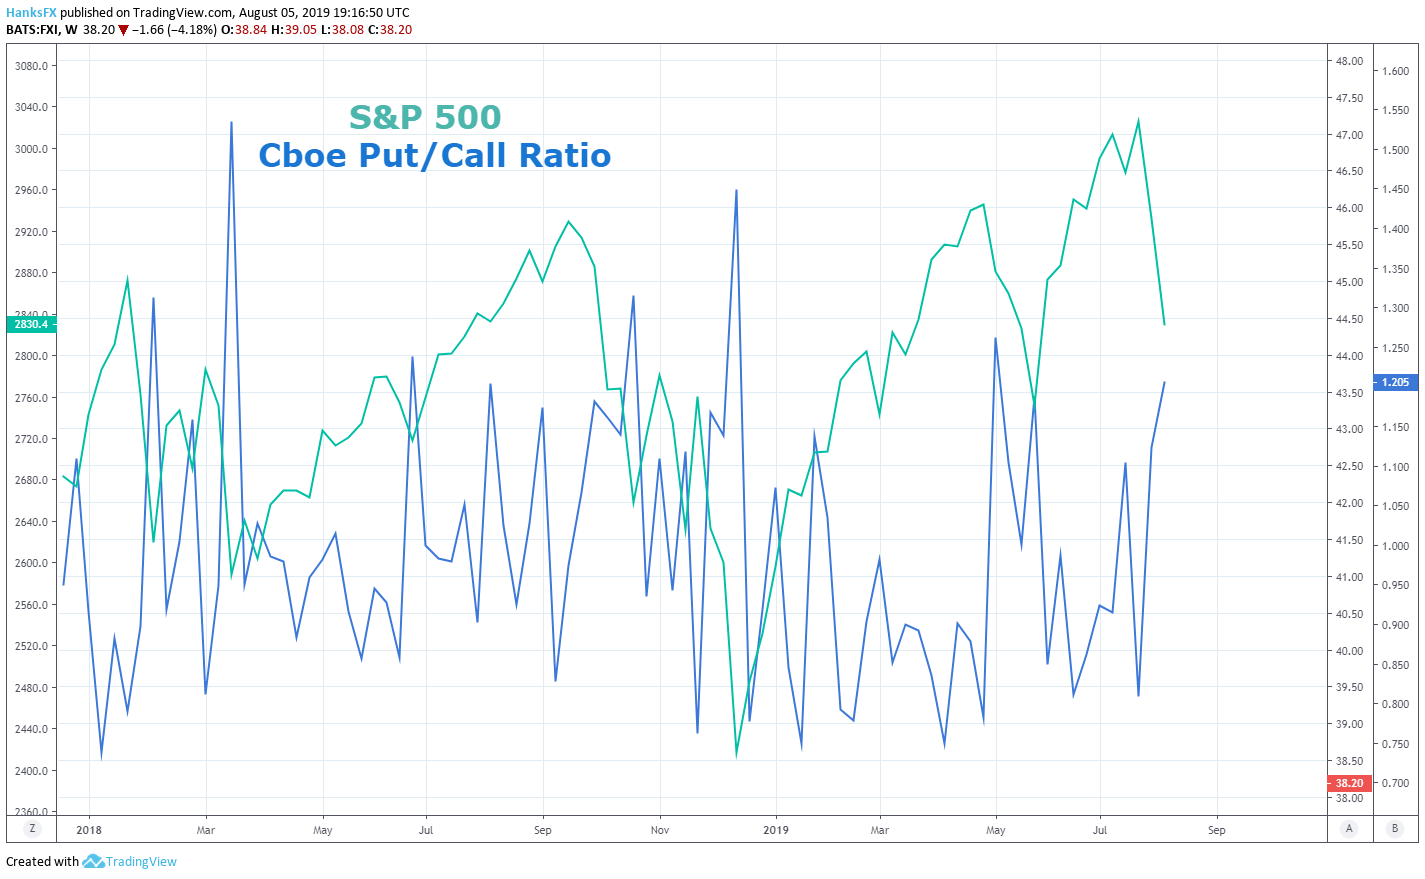
Conversely, the Dow Jones finds itself under immense pressure as it treads water above nearby support. The Industrial Average will look to stay afloat above the 200-day moving average and the 23.6% Fibonacci level around 25,520. Together, the area should offer robust technical support, but the fundamental implications of China’s retaliation may not have been fully fleshed out on Monday. While stocks finished off their intraday lows, Cboe’s put-to-call ratio remained elevated at its highest reading since early May as investors positioned for the possibility of further losses – and rightfully so.
Investors Double Down on Downside Protection
Although a USD/CNH rate above 7.00 may seem insignificant from a spot price perspective, its slippage has the potential to spark capital flight from China if investors lose confidence in the PBOC’s ability – or desire – to maintain a stable currency. If the peg is removed and the US Dollar is allowed to appreciate against the Yuan, it would effectively reduce the value of foreign investment and spur investors to look elsewhere with greater stability. If such an event were to occur, it would likely spark greater risk aversion than was witnessed on Monday despite the Dow suffering its worst decline in 2019.
--Written by Peter Hanks, Junior Analyst for DailyFX.com
Contact and follow Peter on Twitter @PeterHanksFX
Read more: Stocks Sink After President Trump Announces New Tariffs on China


