


S&P 500 Trading Volume Talking Points:
- Traders sat on the sidelines - looking to avoid undue risk during the central bank commentary
- In the days to come, expect volume to pick up as central bank event risk is exchanged for earnings season
- Fresh quarterly forecasts are out! View Q2 forecasts for the S&P 500, US Dollar, British Pound and more.
S&P 500 Trading Volume: A Black Hole Around Fed Minutes
S&P 500 trading volume slipped into a black hole ahead of Wednesday’s FOMC meeting minutes as traders saw little cause to weather the event risk. April alone has delivered 5 of the index’s 6 lowest volume trading sessions, and volume’s moving average has slipped to its lowest level since late September 2018.
S&P 500 Price Chart: Daily Time Frame (September 2018 - April 2019) (Chart 1)
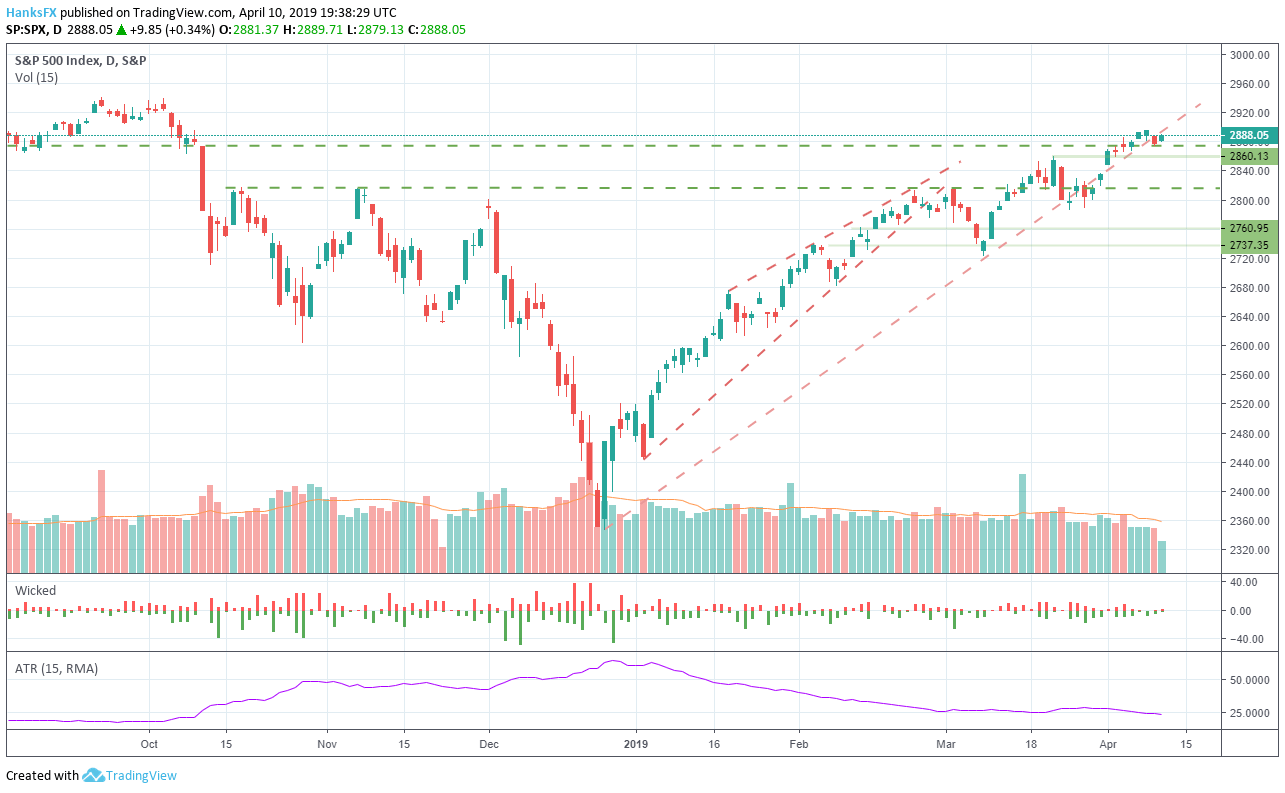
Similarly, the index’s average true range has fallen alongside volume. That said, traders are oft reluctant to risk exposure during Fed meetings. In the following days of an event, average volume is frequently heightened, and the highs are astronomical – suggesting traders are coping with a notably revised policy outlook.
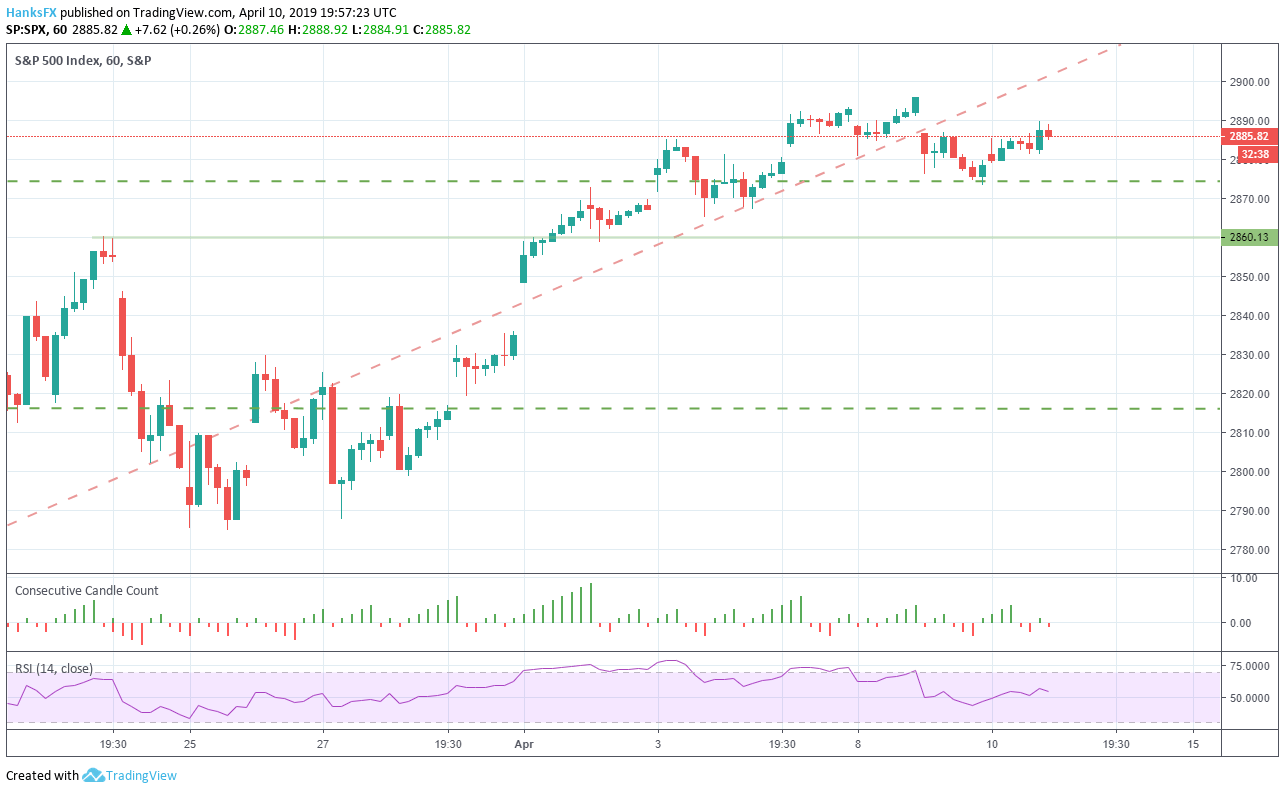
S&P Trading Volume and the Fed (Chart 2)

Data compiled from Bloomberg
Despite Thursday’s sparse economic calendar, volume should pick up – albeit not to the same degree given the uneventful minutes release. With event risk in the rear-view, traders can look to the future and position for earnings season and the implications from an announcement from US Treasury Secretary Steven Mnuchin on trade war progress.
S&P 500 Price Chart: 1 – Hour Time Frame (March 24 – April 10) (Chart 3)
As for the technical perspective of the index, it trades narrowly beneath trendline resistance from late December. Although the line has been subject to breaks, it continues to influence price action. Conversely, the S&P 500 has horizontal trendline support from the high of February 2018 beneath it at 2875. With earnings on the horizon, IG clients have only increased their short exposure.
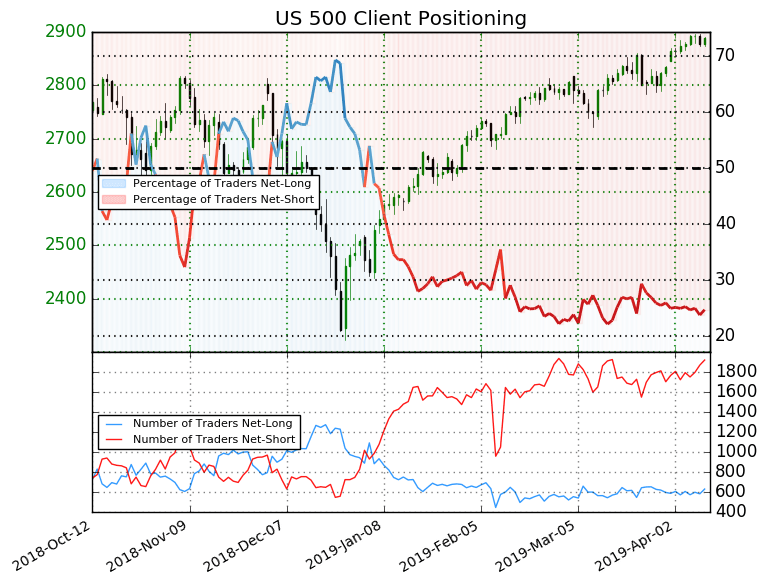
Retail trader data shows 24.8% of traders are net-long with the ratio of traders short to long at 3.04 to 1. Since we typically take a contrarian view to crowd sentiment, the fact that retail traders are overwhelmingly short suggests the S&P 500 may continue its recent trend.
--Written by Peter Hanks, Junior Analyst for DailyFX.com
Contact and follow Peter on Twitter @PeterHanksFX
Read more: Tech Sector: Highest Ratio to the S&P 500 Since Dot-Com Bubble
DailyFX forecasts on a variety of currencies such as the US Dollar or the Euro are available from the DailyFX Trading Guides page. If you’re looking to improve your trading approach, check out Traits of Successful Traders. And if you’re looking for an introductory primer to the Forex market, check out our New to FX Guide.


