


Tech Sector Talking Points:
- The XLK ETF currently trades at its highest level ever and closed Monday’s session with the largest share of the S&P 500 since January 2001
- The S&P 500 is within reach of all-time highs heading into Wednesday’s release of FOMC meeting minutes
- Learn to utilize IG Client Sentiment Data effectively with one of our many Live Sentiment Data Walkthroughs.
Tech Sector: Highest Ratio to the S&P 500 Since Dot-Com Bubble
The tech sector continued its history of outperformance this week, as the XLK ETF reached record highs. Compared to the S&P 500, the sector boasts its highest ratio versus the index since the latter half of the dot-com bubble burst in January 2001. On a single stock basis, Apple once again approaches a $1 trillion valuation just months after it revised growth forecasts lower and spurred a UDSJPY flash crash.
S&P 500 Price Chart: Monthly Time Frame (August 1999 – April 2019) (Chart 1)
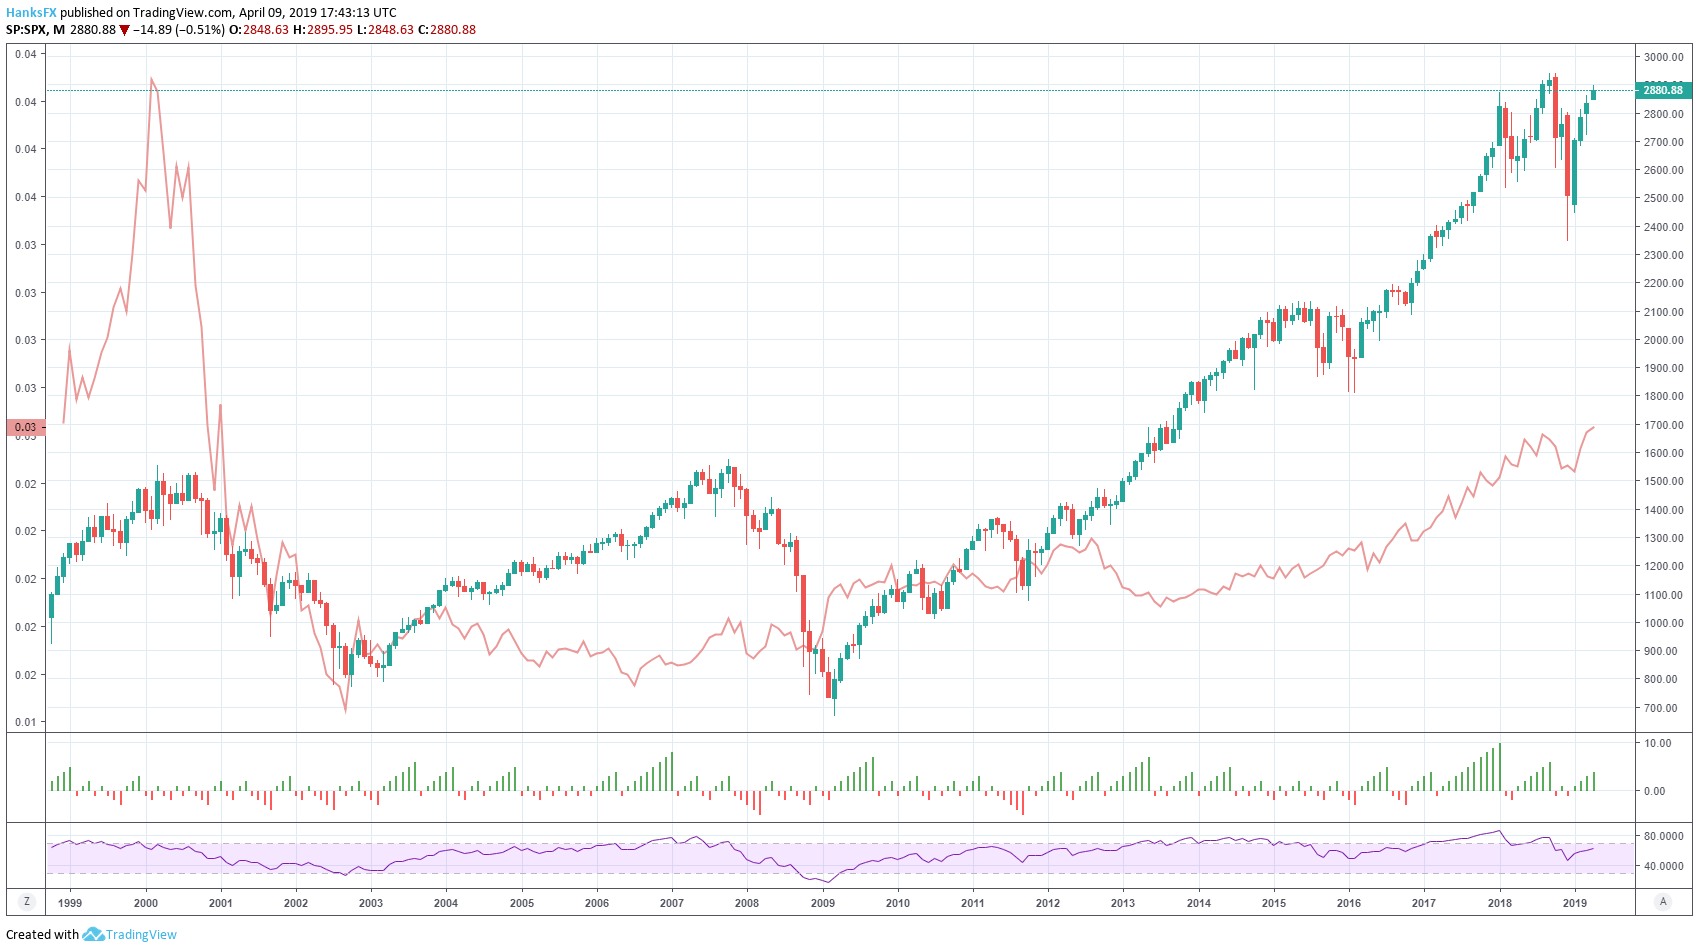
XLK/S&P 500 ratio overlaid in red
With the index itself grasping to recapture record levels, the strength of the current rally looks to be waning amid mounting headwinds ahead of Wednesday’s FOMC meeting minutes. Global growth concerns, trade war fears and earnings season jitters have all sought to derail investor sentiment just as some of the index’s favorite names have reclaimed their luster. Wednesday’s Fed minutes and a corresponding ECB policy decision may carry enough weight to deliver a meaningful shift in sentiment.
View our Economic Calendar for FOMC meeting minutes and ECB rate decisions.
Tuesday’s “calm before the storm” tepidness was reflected in low trading volume (the lowest for the index in five months) for the S&P 500 and a slight increase in the VIX. Elsewhere, anticipation for the events was reflected in heightened implied volatility across several currency pairs – especially EURUSD.
S&P 500 Price Chart: Daily Time Frame (November 2018 – April 2019) (Price Chart 2)

Overlaid with CBOE Volatility index (VIX) in blue
Given the nature of the events and increased liquidity and leverage offered in the currency market, it may be a more appropriate space to explore trading opportunities ahead of tomorrow’s event risk - even with cracks in the S&P 500’s armor.
Fresh quarterly forecasts are out! View Q2 forecasts for the S&P 500, US Dollar, British Pound and more.
--Written by Peter Hanks, Junior Analyst for DailyFX.com
Contact and follow Peter on Twitter @PeterHanksFX
Read more: Emerging Markets Crisis Monitor - Seven Factors Traders Should Watch
DailyFX forecasts on a variety of currencies such as the US Dollar or the Euro are available from the DailyFX Trading Guides page. If you’re looking to improve your trading approach, check out Traits of Successful Traders. And if you’re looking for an introductory primer to the Forex market, check out our New to FX Guide.


